A climate resilience platform helping communities and cities track, report, and analyze environmental impacts.
ISeeChange
Brief
B2B – Redesign the customer dashboard and customer lead website.
B2C – FloodTracker, HeatTracker and ISC apps.
Unified the visual identity and UX system, making complex climate data actionable for both public users and enterprise clients.
Methods
Led the overall design and created a design system that unified the branding. Designed a map-based dashboard and intuitive reporting tools.
Conducted user interviews and usability testing. Managed front-end updates and collaboration with developers.
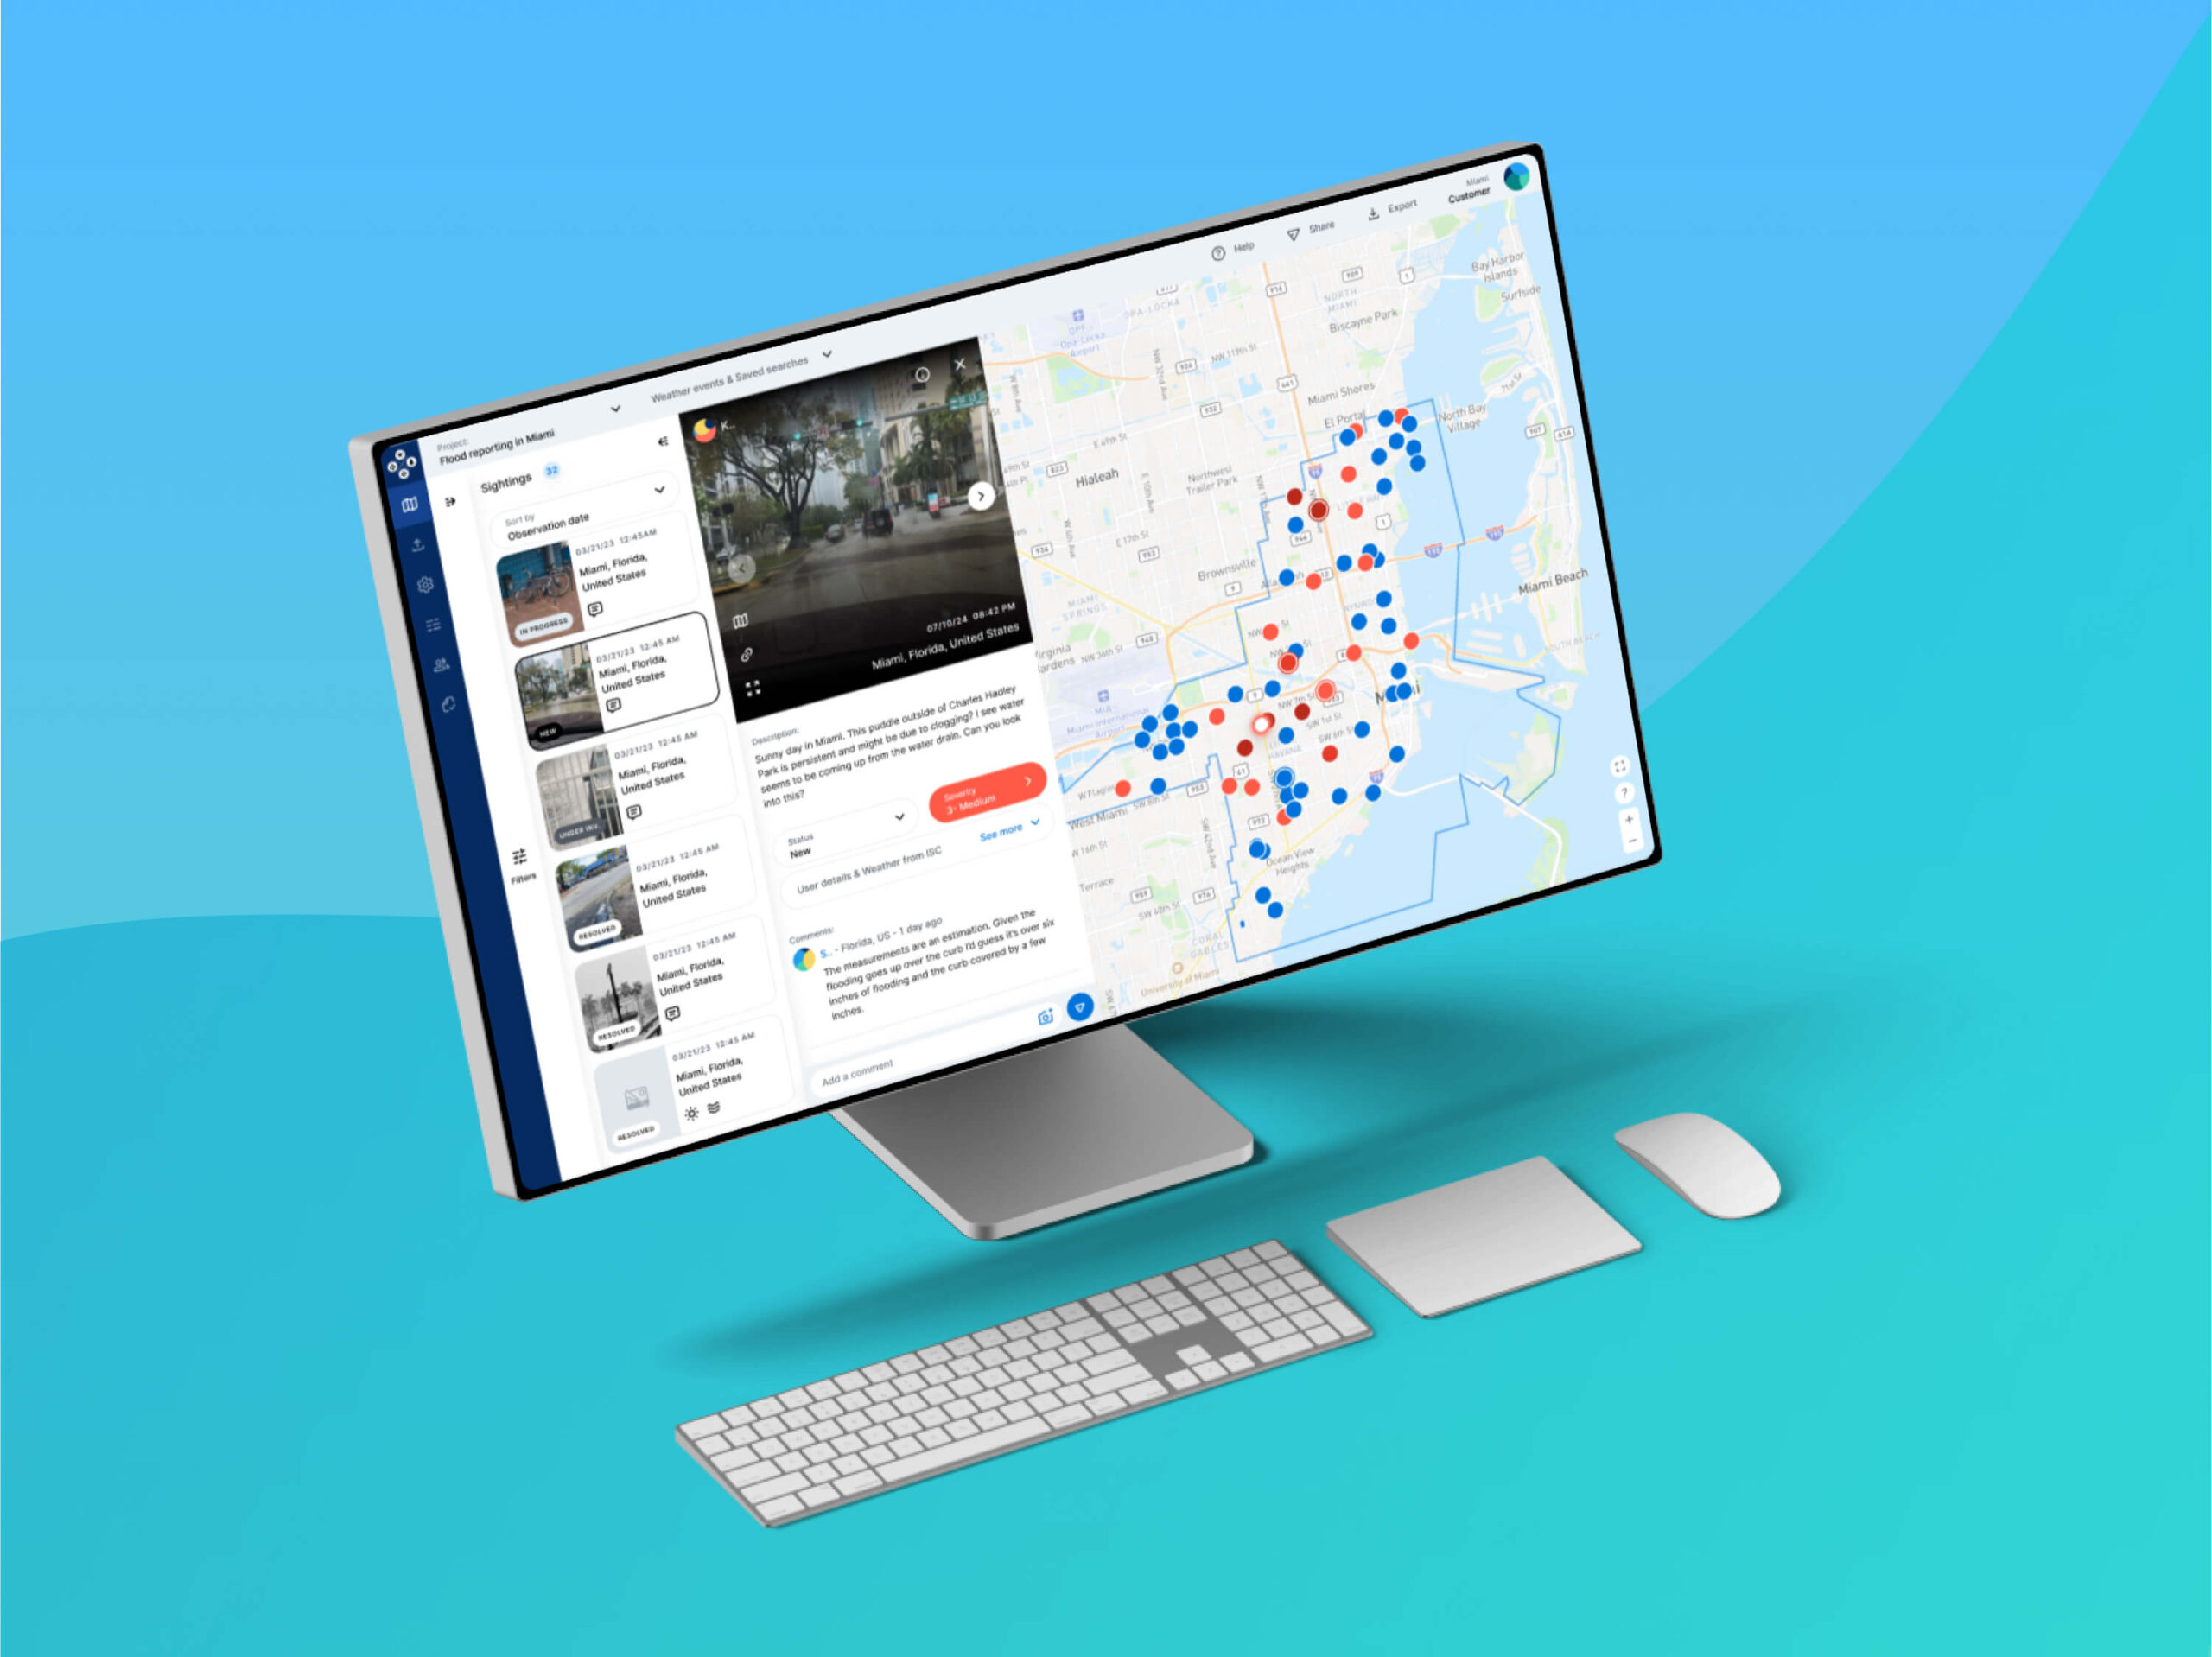
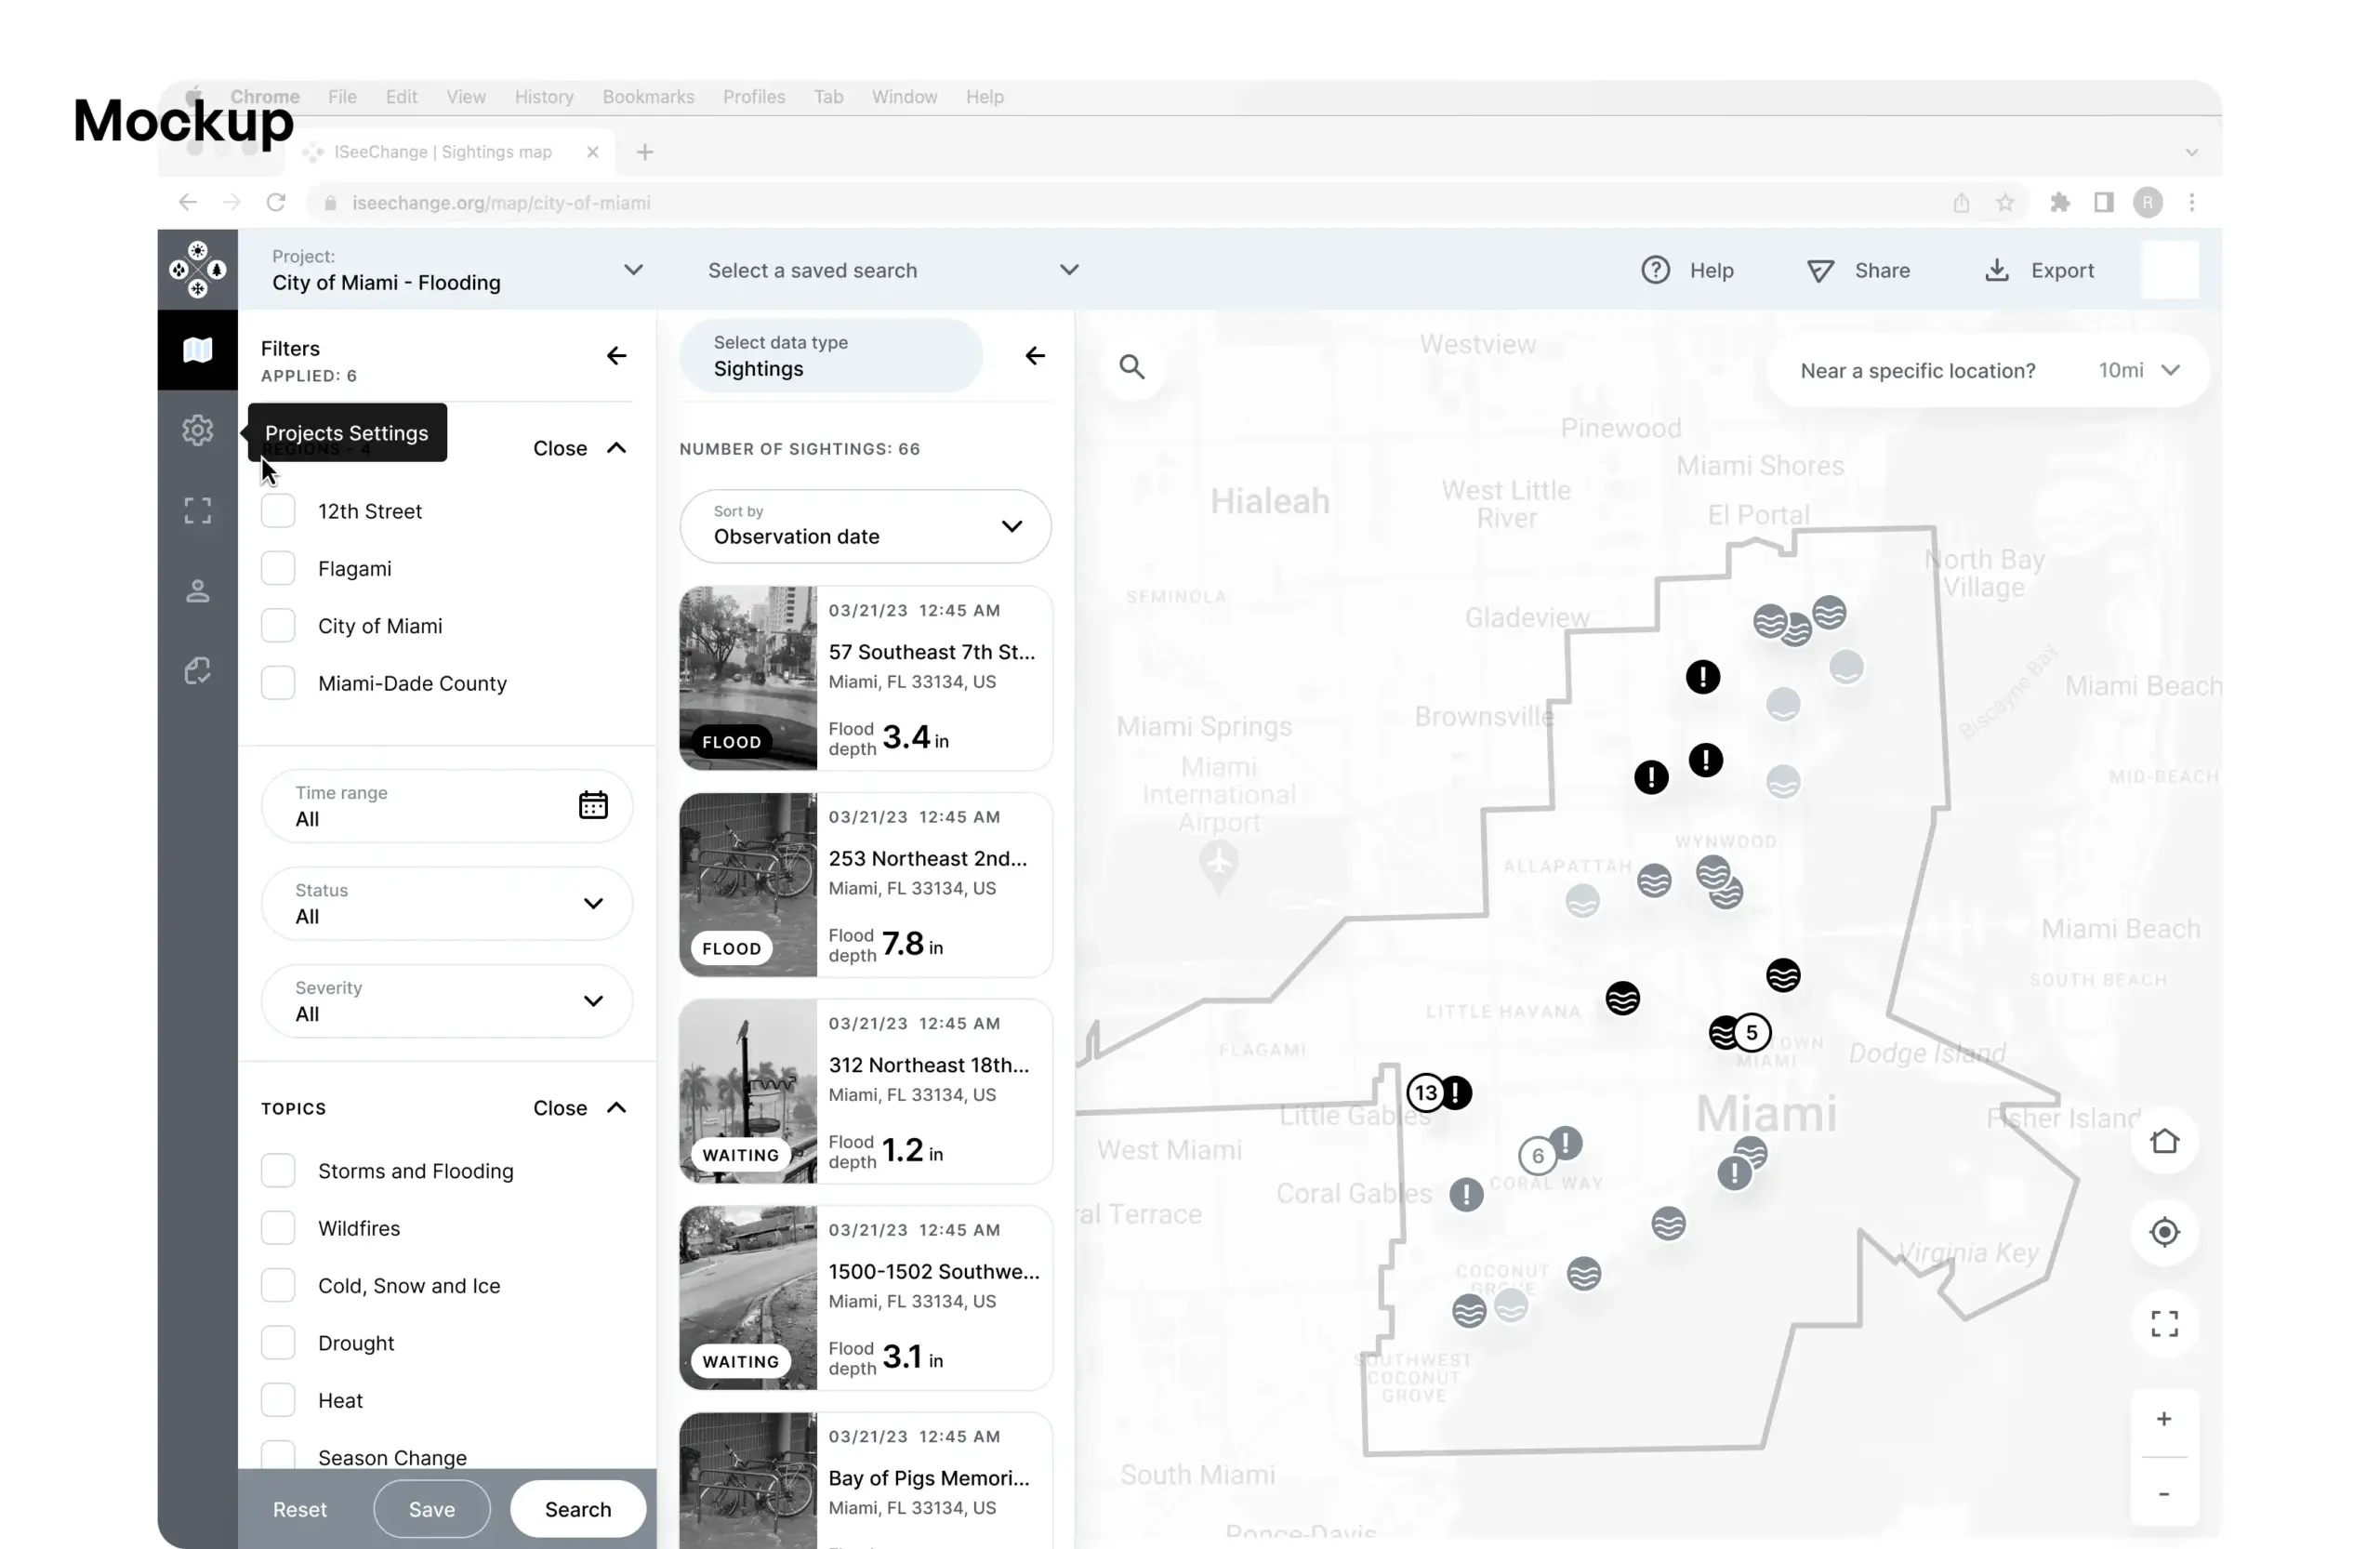
Customer Dashboard
-
The Customer Dashboard was my most complex project at ISeeChange.
-
It’s a map-based tool for cities and utilities to explore citizen climate data—supporting real-time response and long-term planning.
-
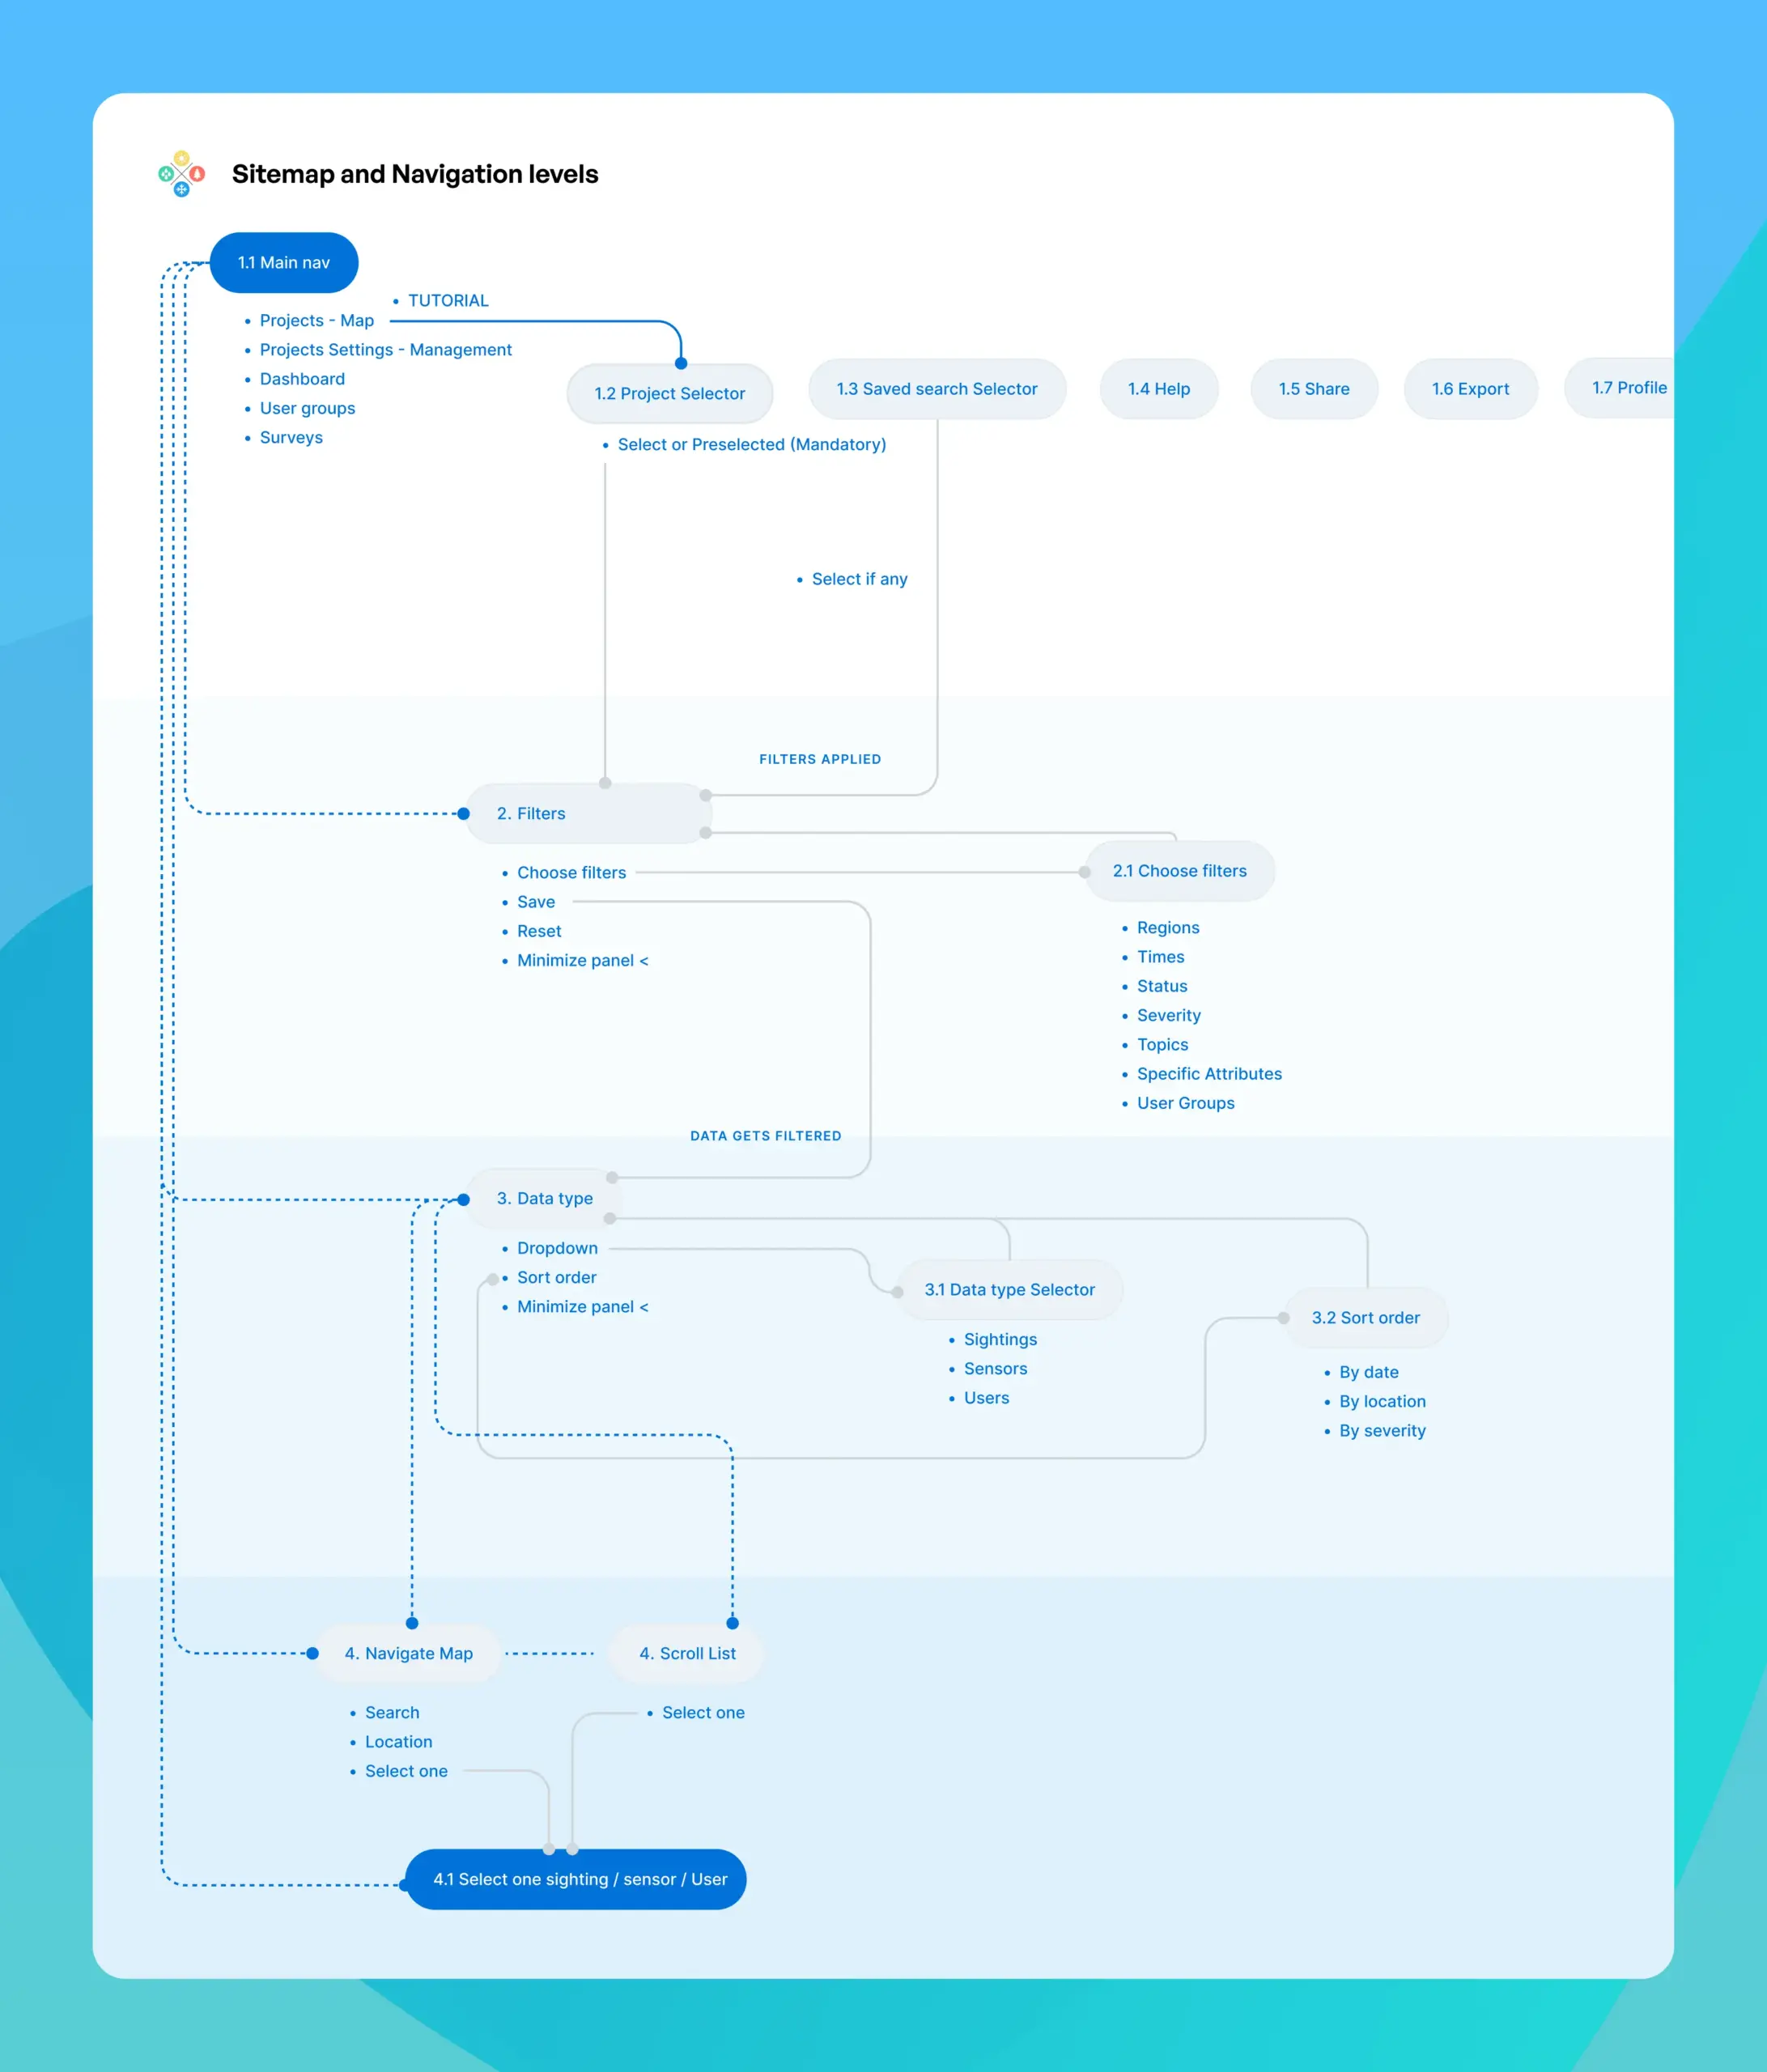
I designed a detailed sitemap and navigation for layered features like map and list views, keeping the experience simple and clear
Navigation
The platform includes three levels of navigation, each designed to help users manage complex climate data with ease:
-
Main menu
core sections: Projects map, Settings, User Groups, and Surveys. -
Filter panel
lets users narrow data by region, time, status, severity, topics, attributes, and groups. -
View controls
switch between sightings, sensors, and user data in list or map views.
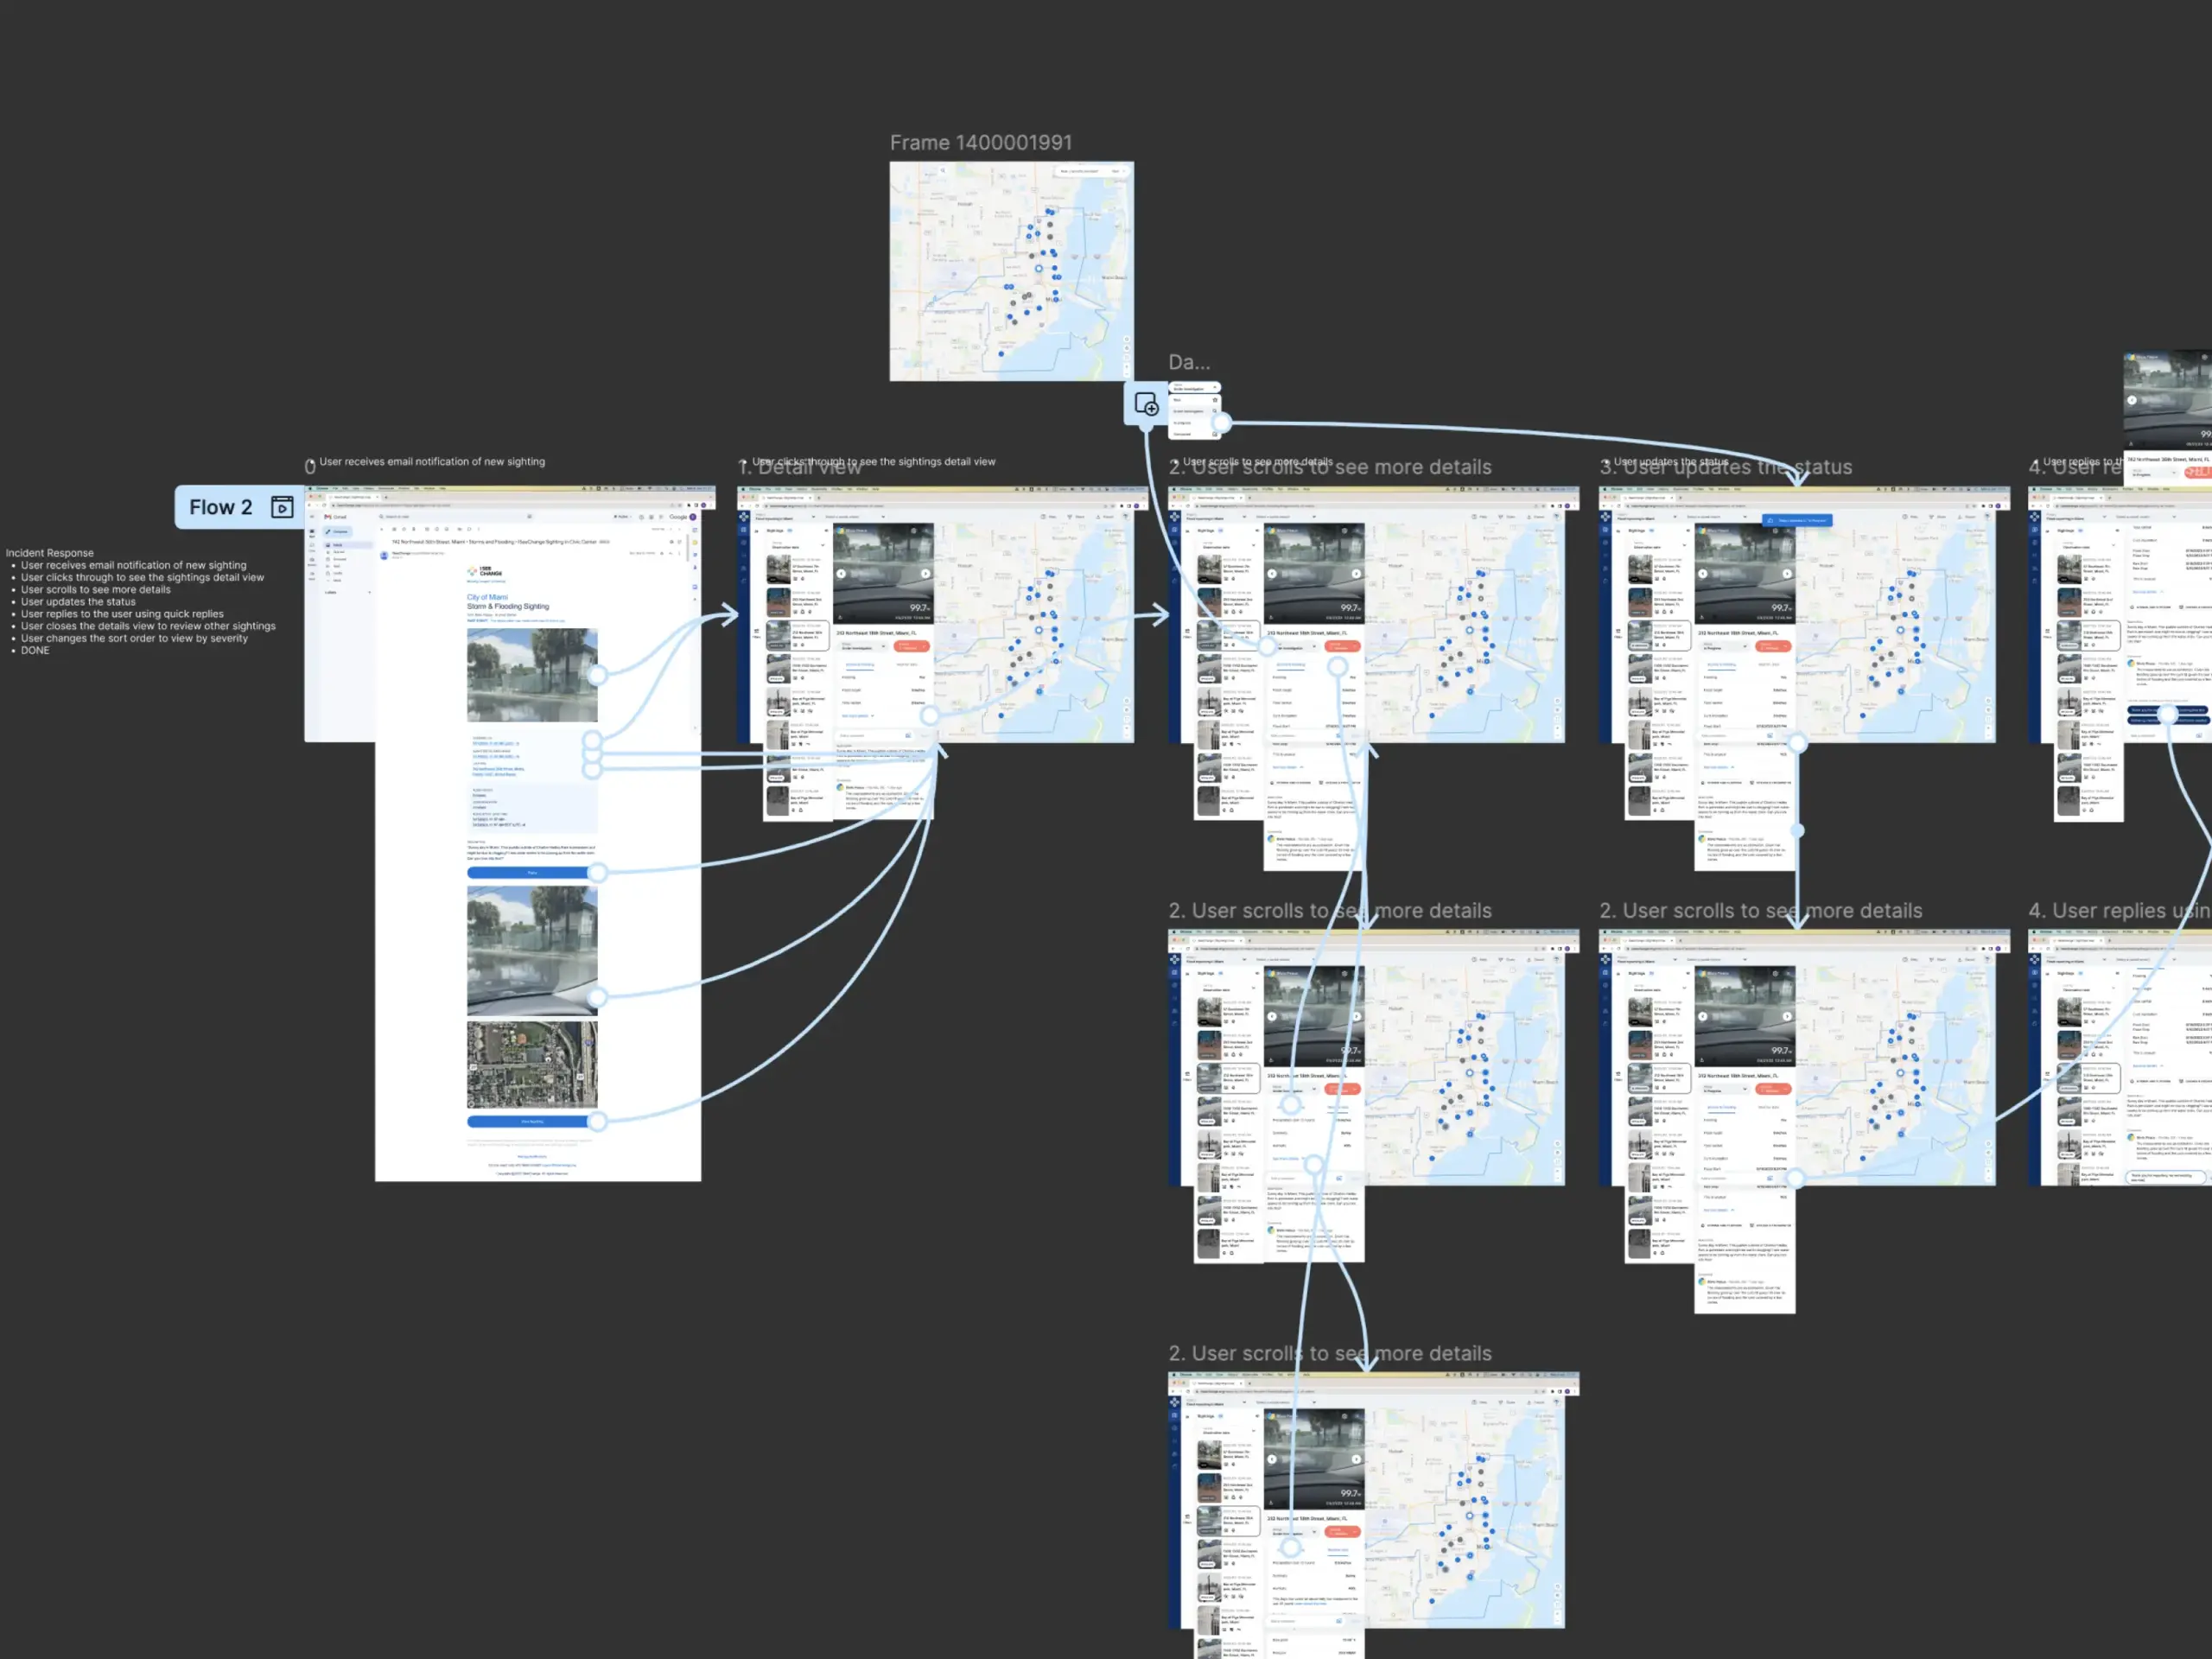
Prototyping
The prototypes, developed from the initial mockups, were designed to support incident response and infrastructure planning.
We tested them with cities and utilities to assess usability and understand which features and workflows were most effective in real-world scenarios.
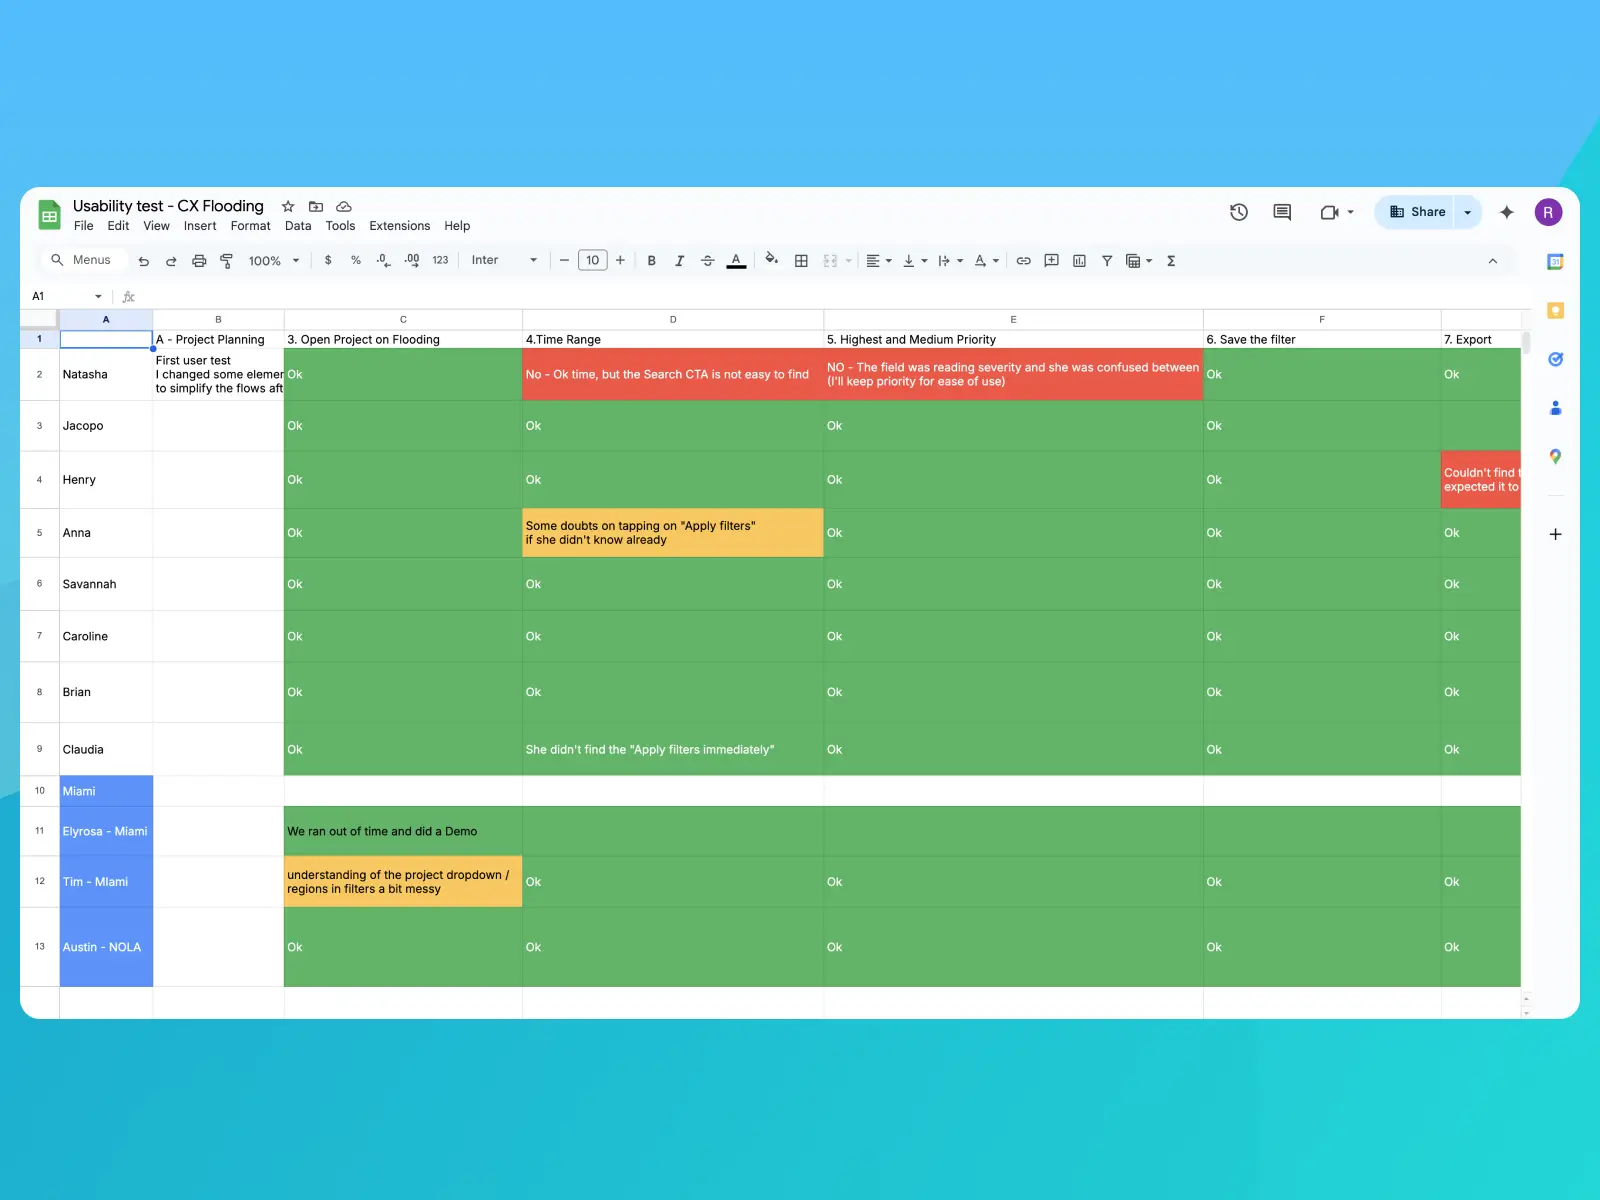
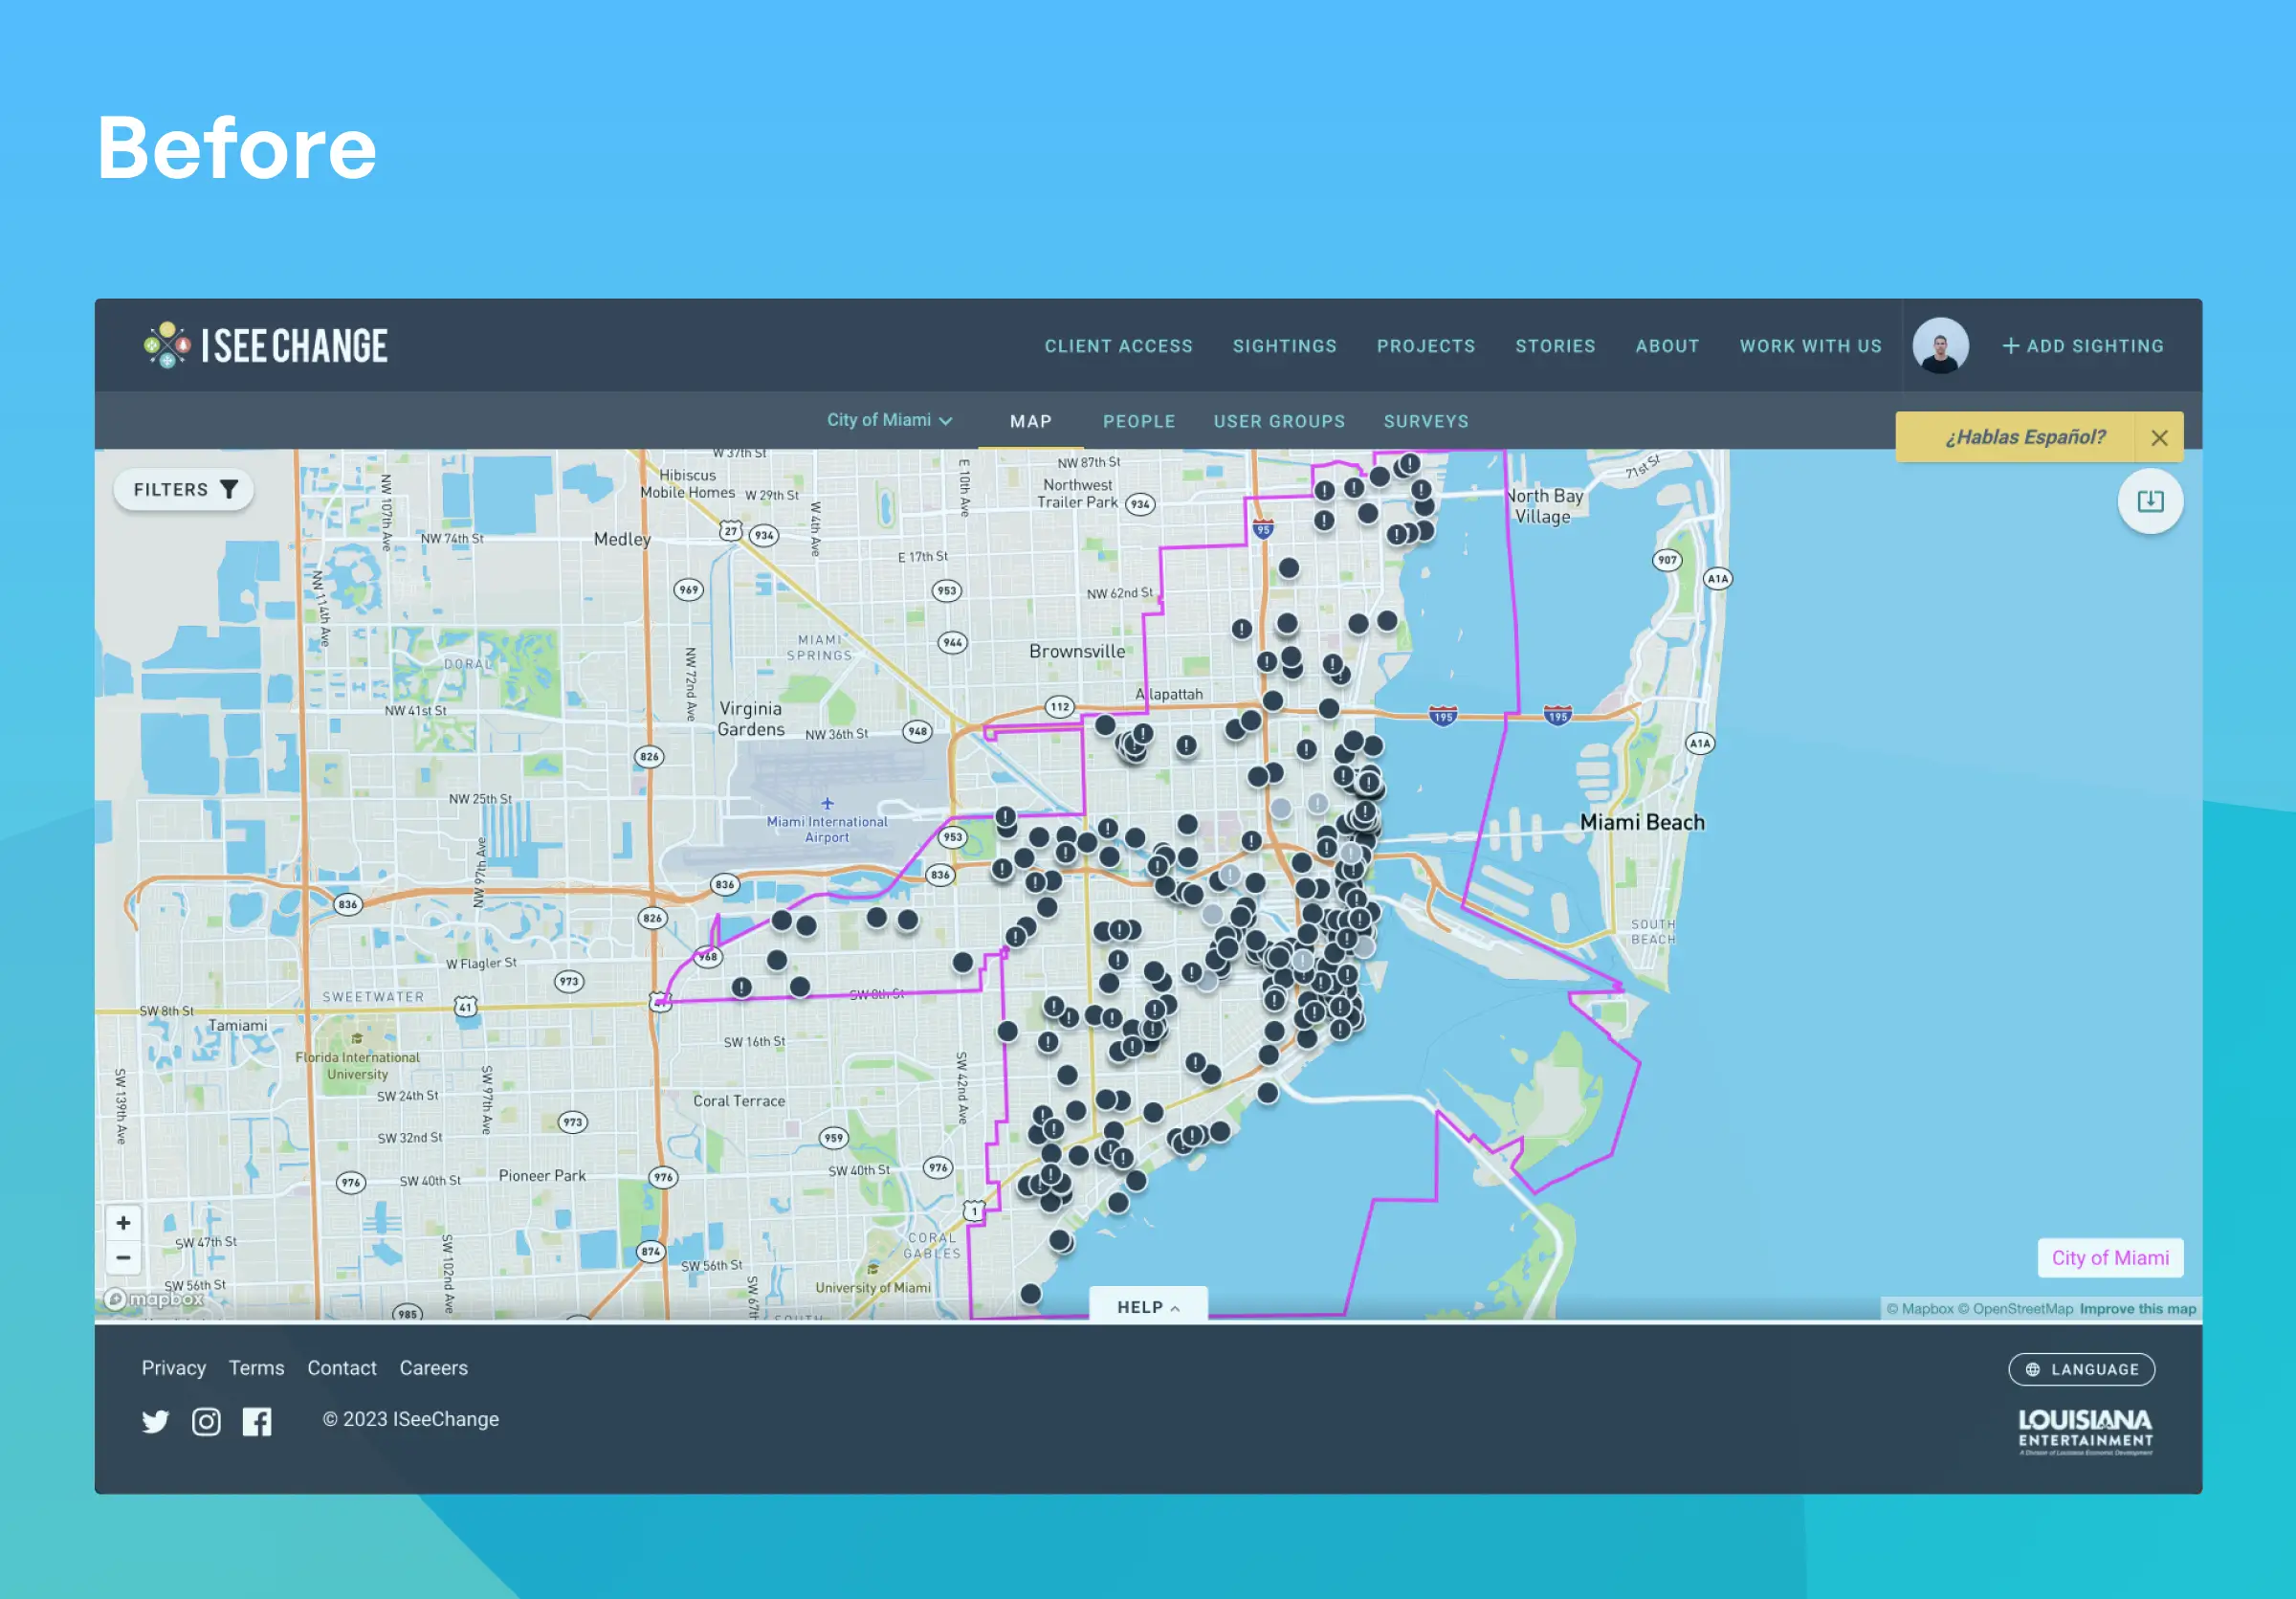
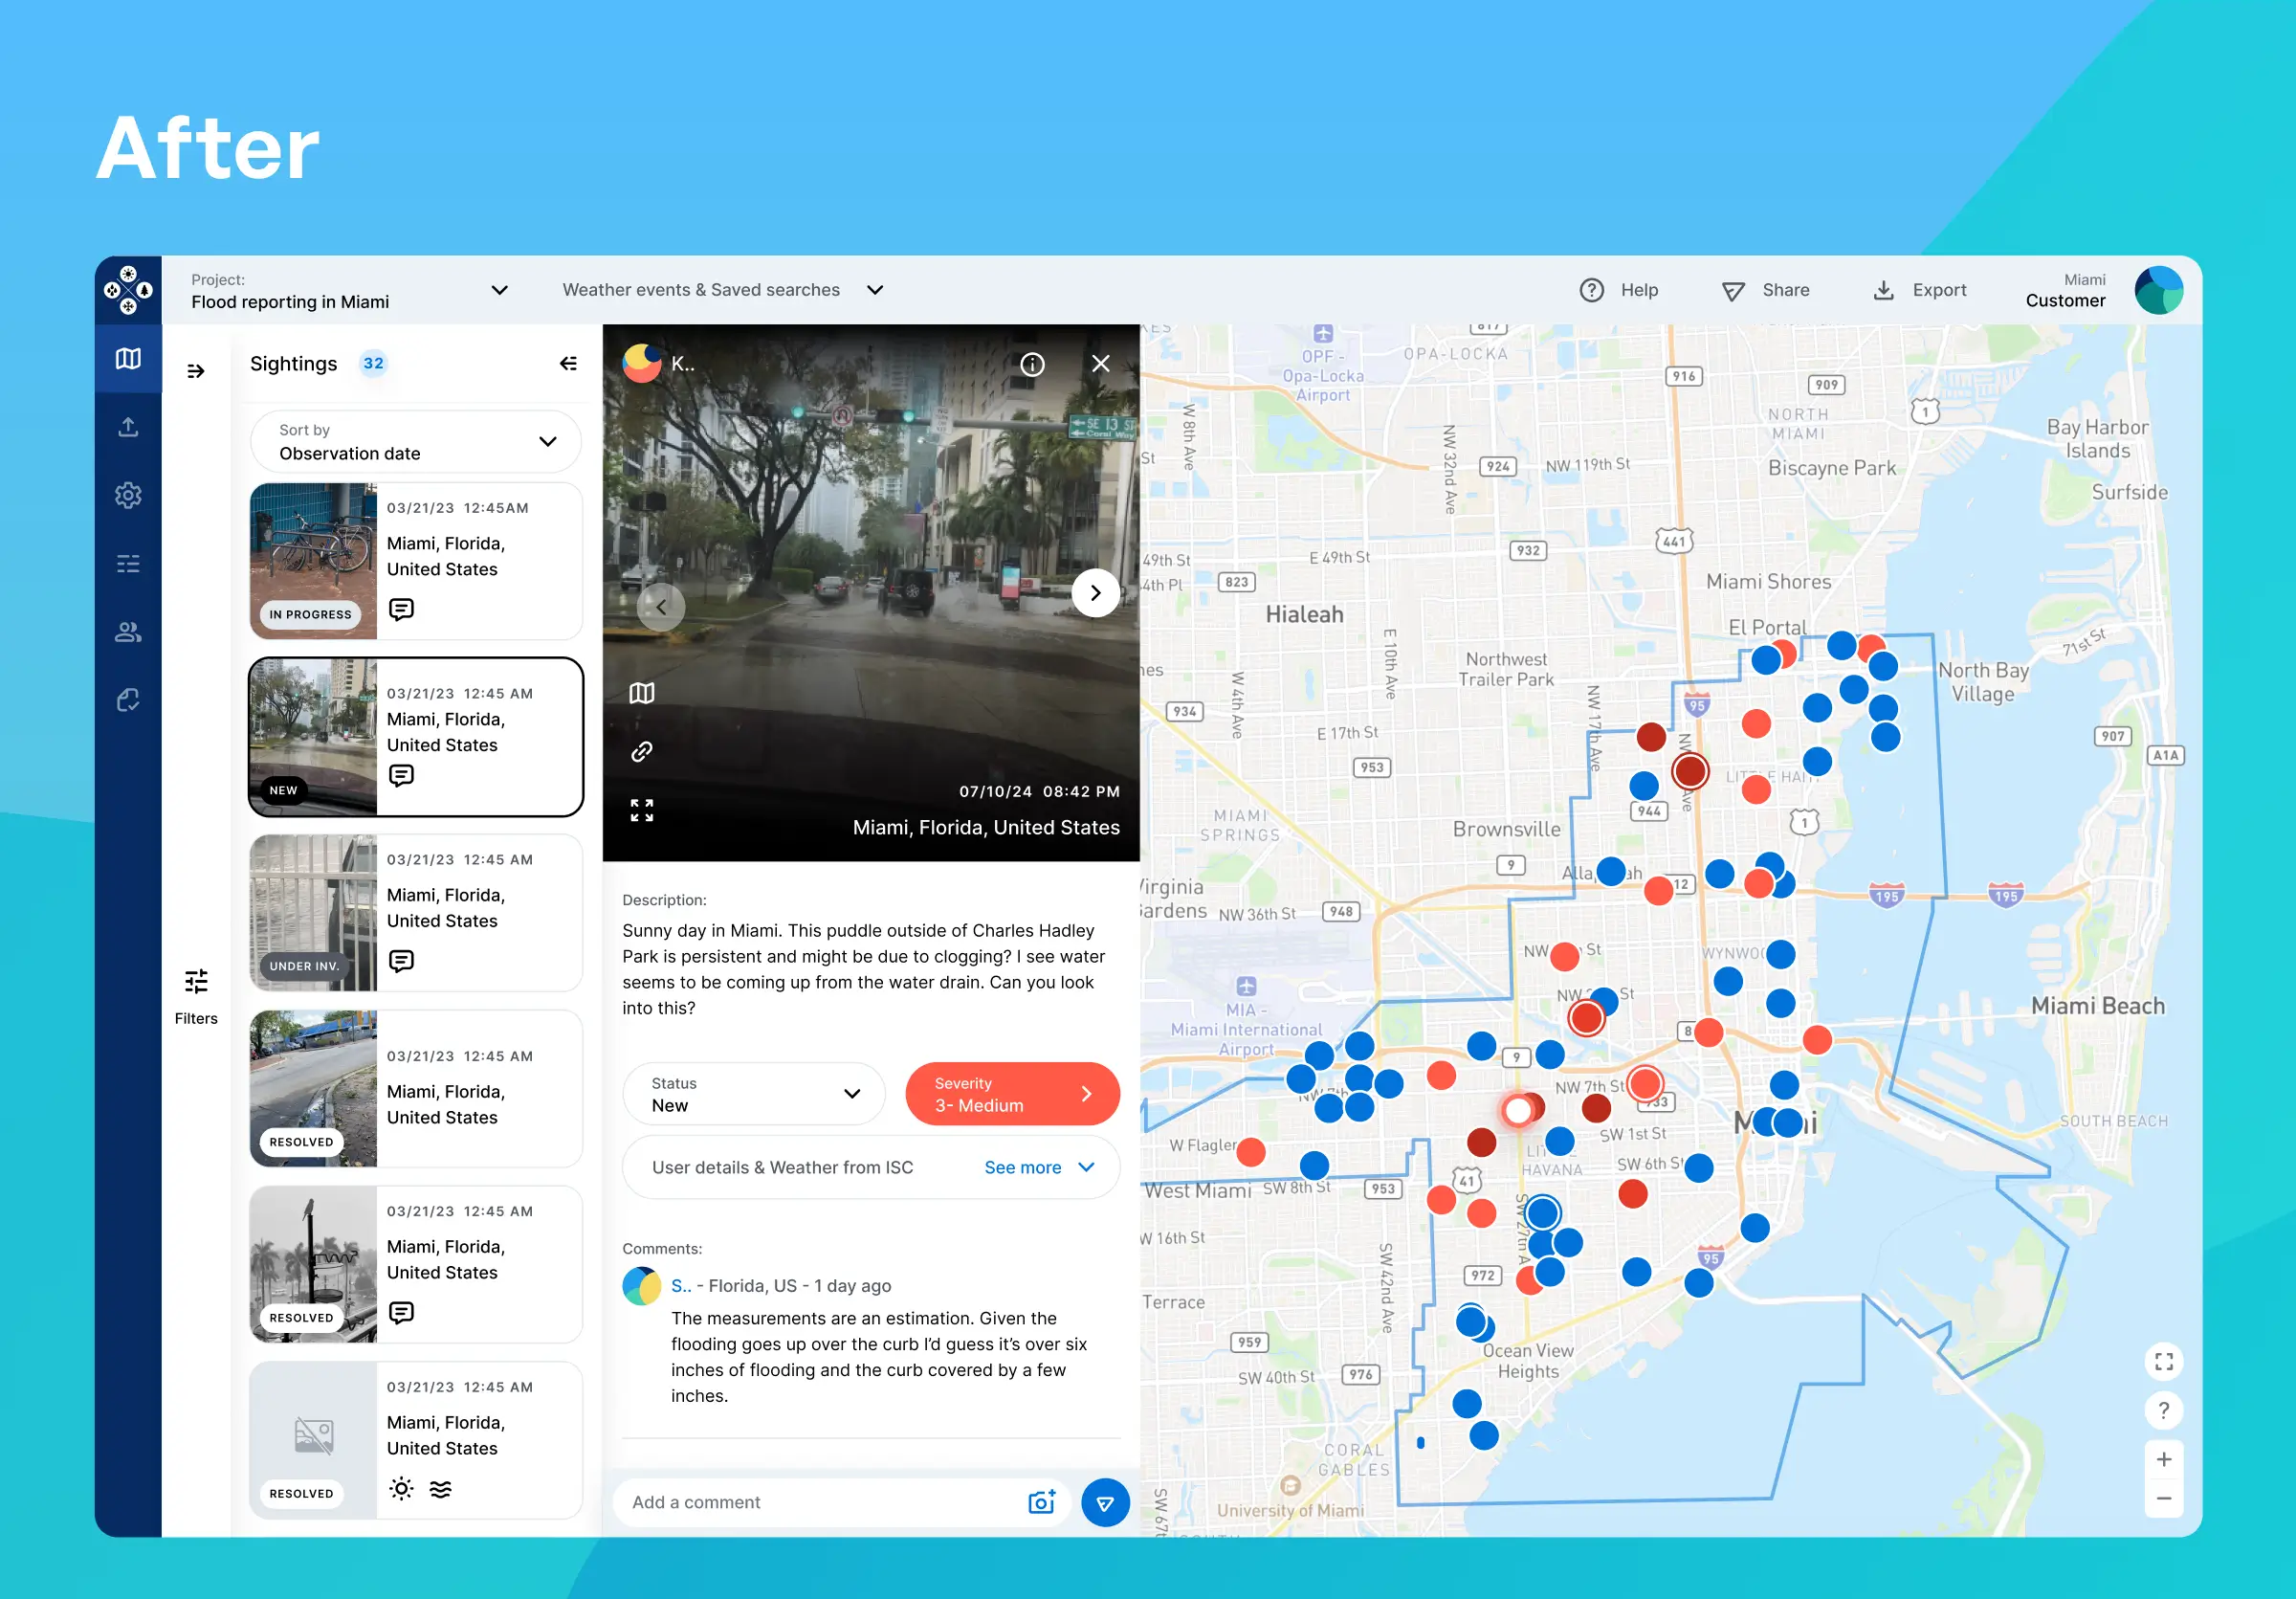
Usability and Final Designs
We ran usability tests with officials from the City of Miami, Miami-Dade County, and New Orleans.
These sessions helped us understand how easily users could navigate the platform, and shaped which features mattered most based on workflows and priorities.
The final interface combined all tested elements into a clean, responsive design. It was tailored for city officials and utility teams, with a focus on clarity, speed, and confident decision-making.
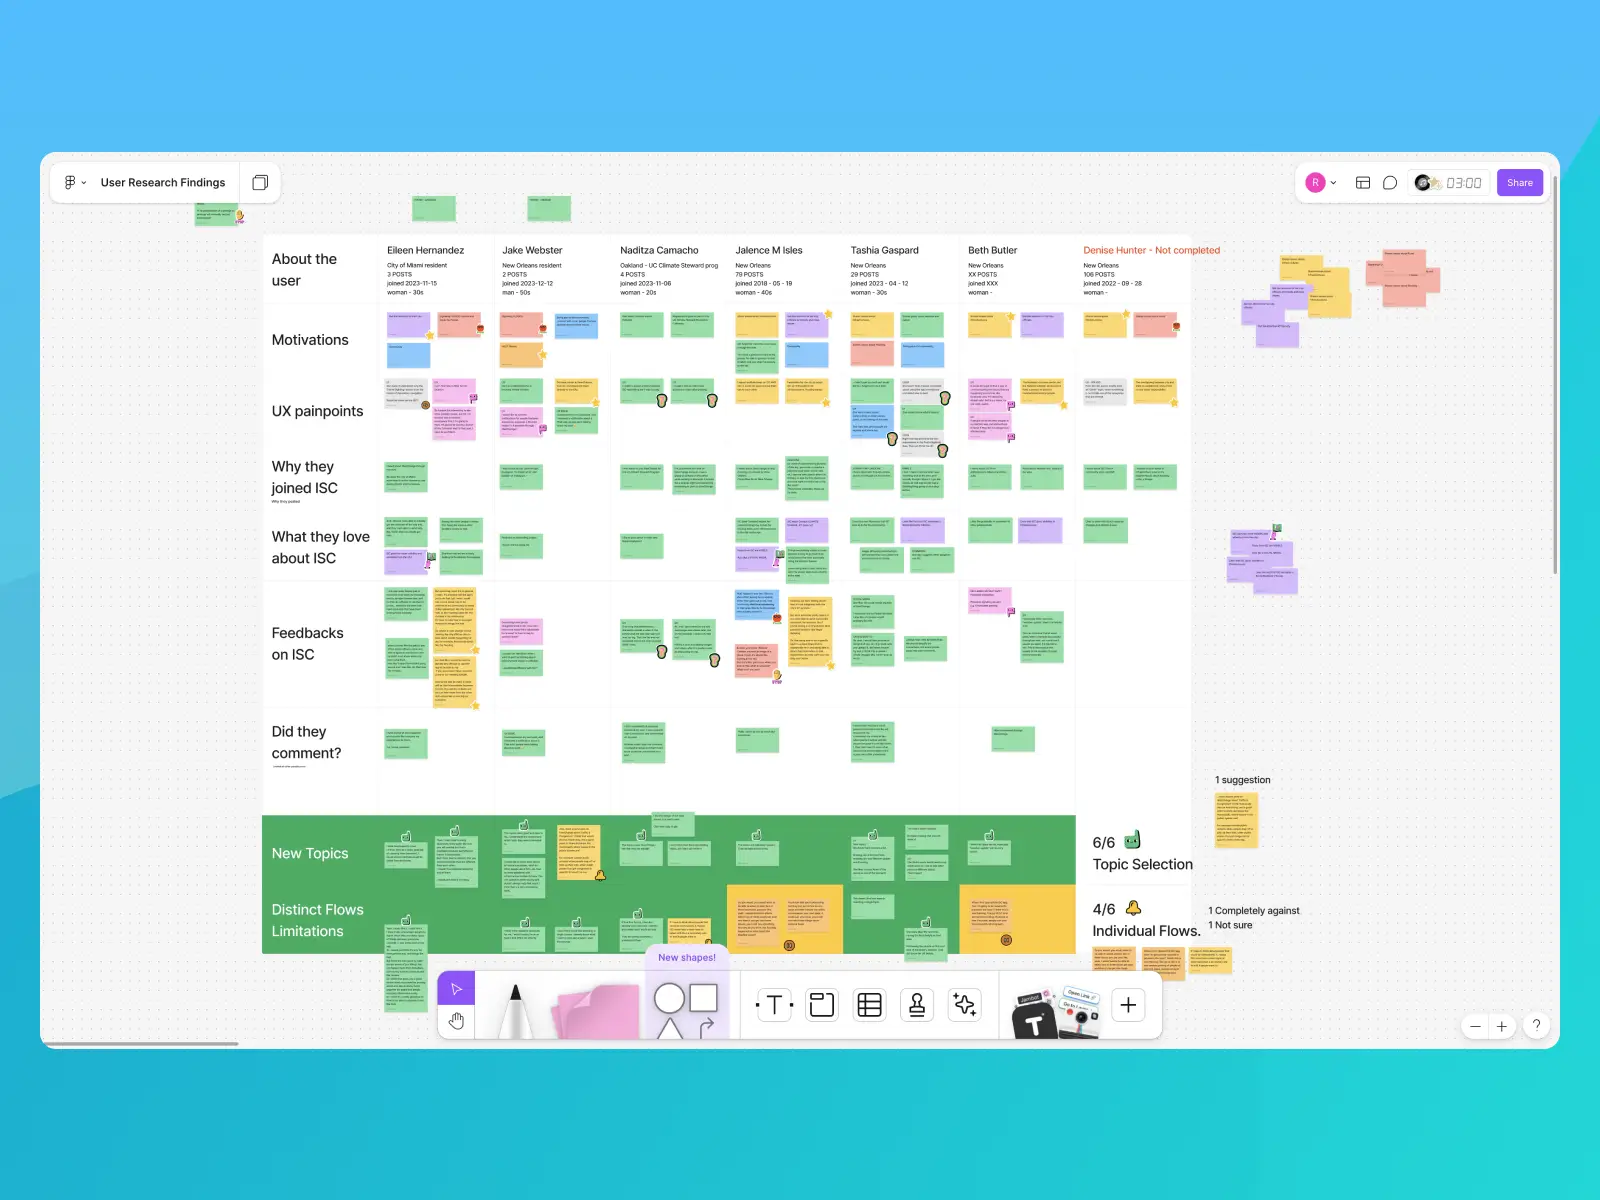
Apps - User Research
Beyond the dashboard, I conducted qualitative interviews with active users to uncover pain points and unmet needs.
Insights from these conversations directly informed new posting and tracking flows that better aligned with real user behavior.
These improvements increased engagement and made the platform easier to use over time.
Apps Redesigns
Insights from these interviews led to a broader redesign of key parts of the main apps and websites.
We reworked navigation patterns, redesigned the post creation flow, and helped shift the overall product direction to support how users interact.
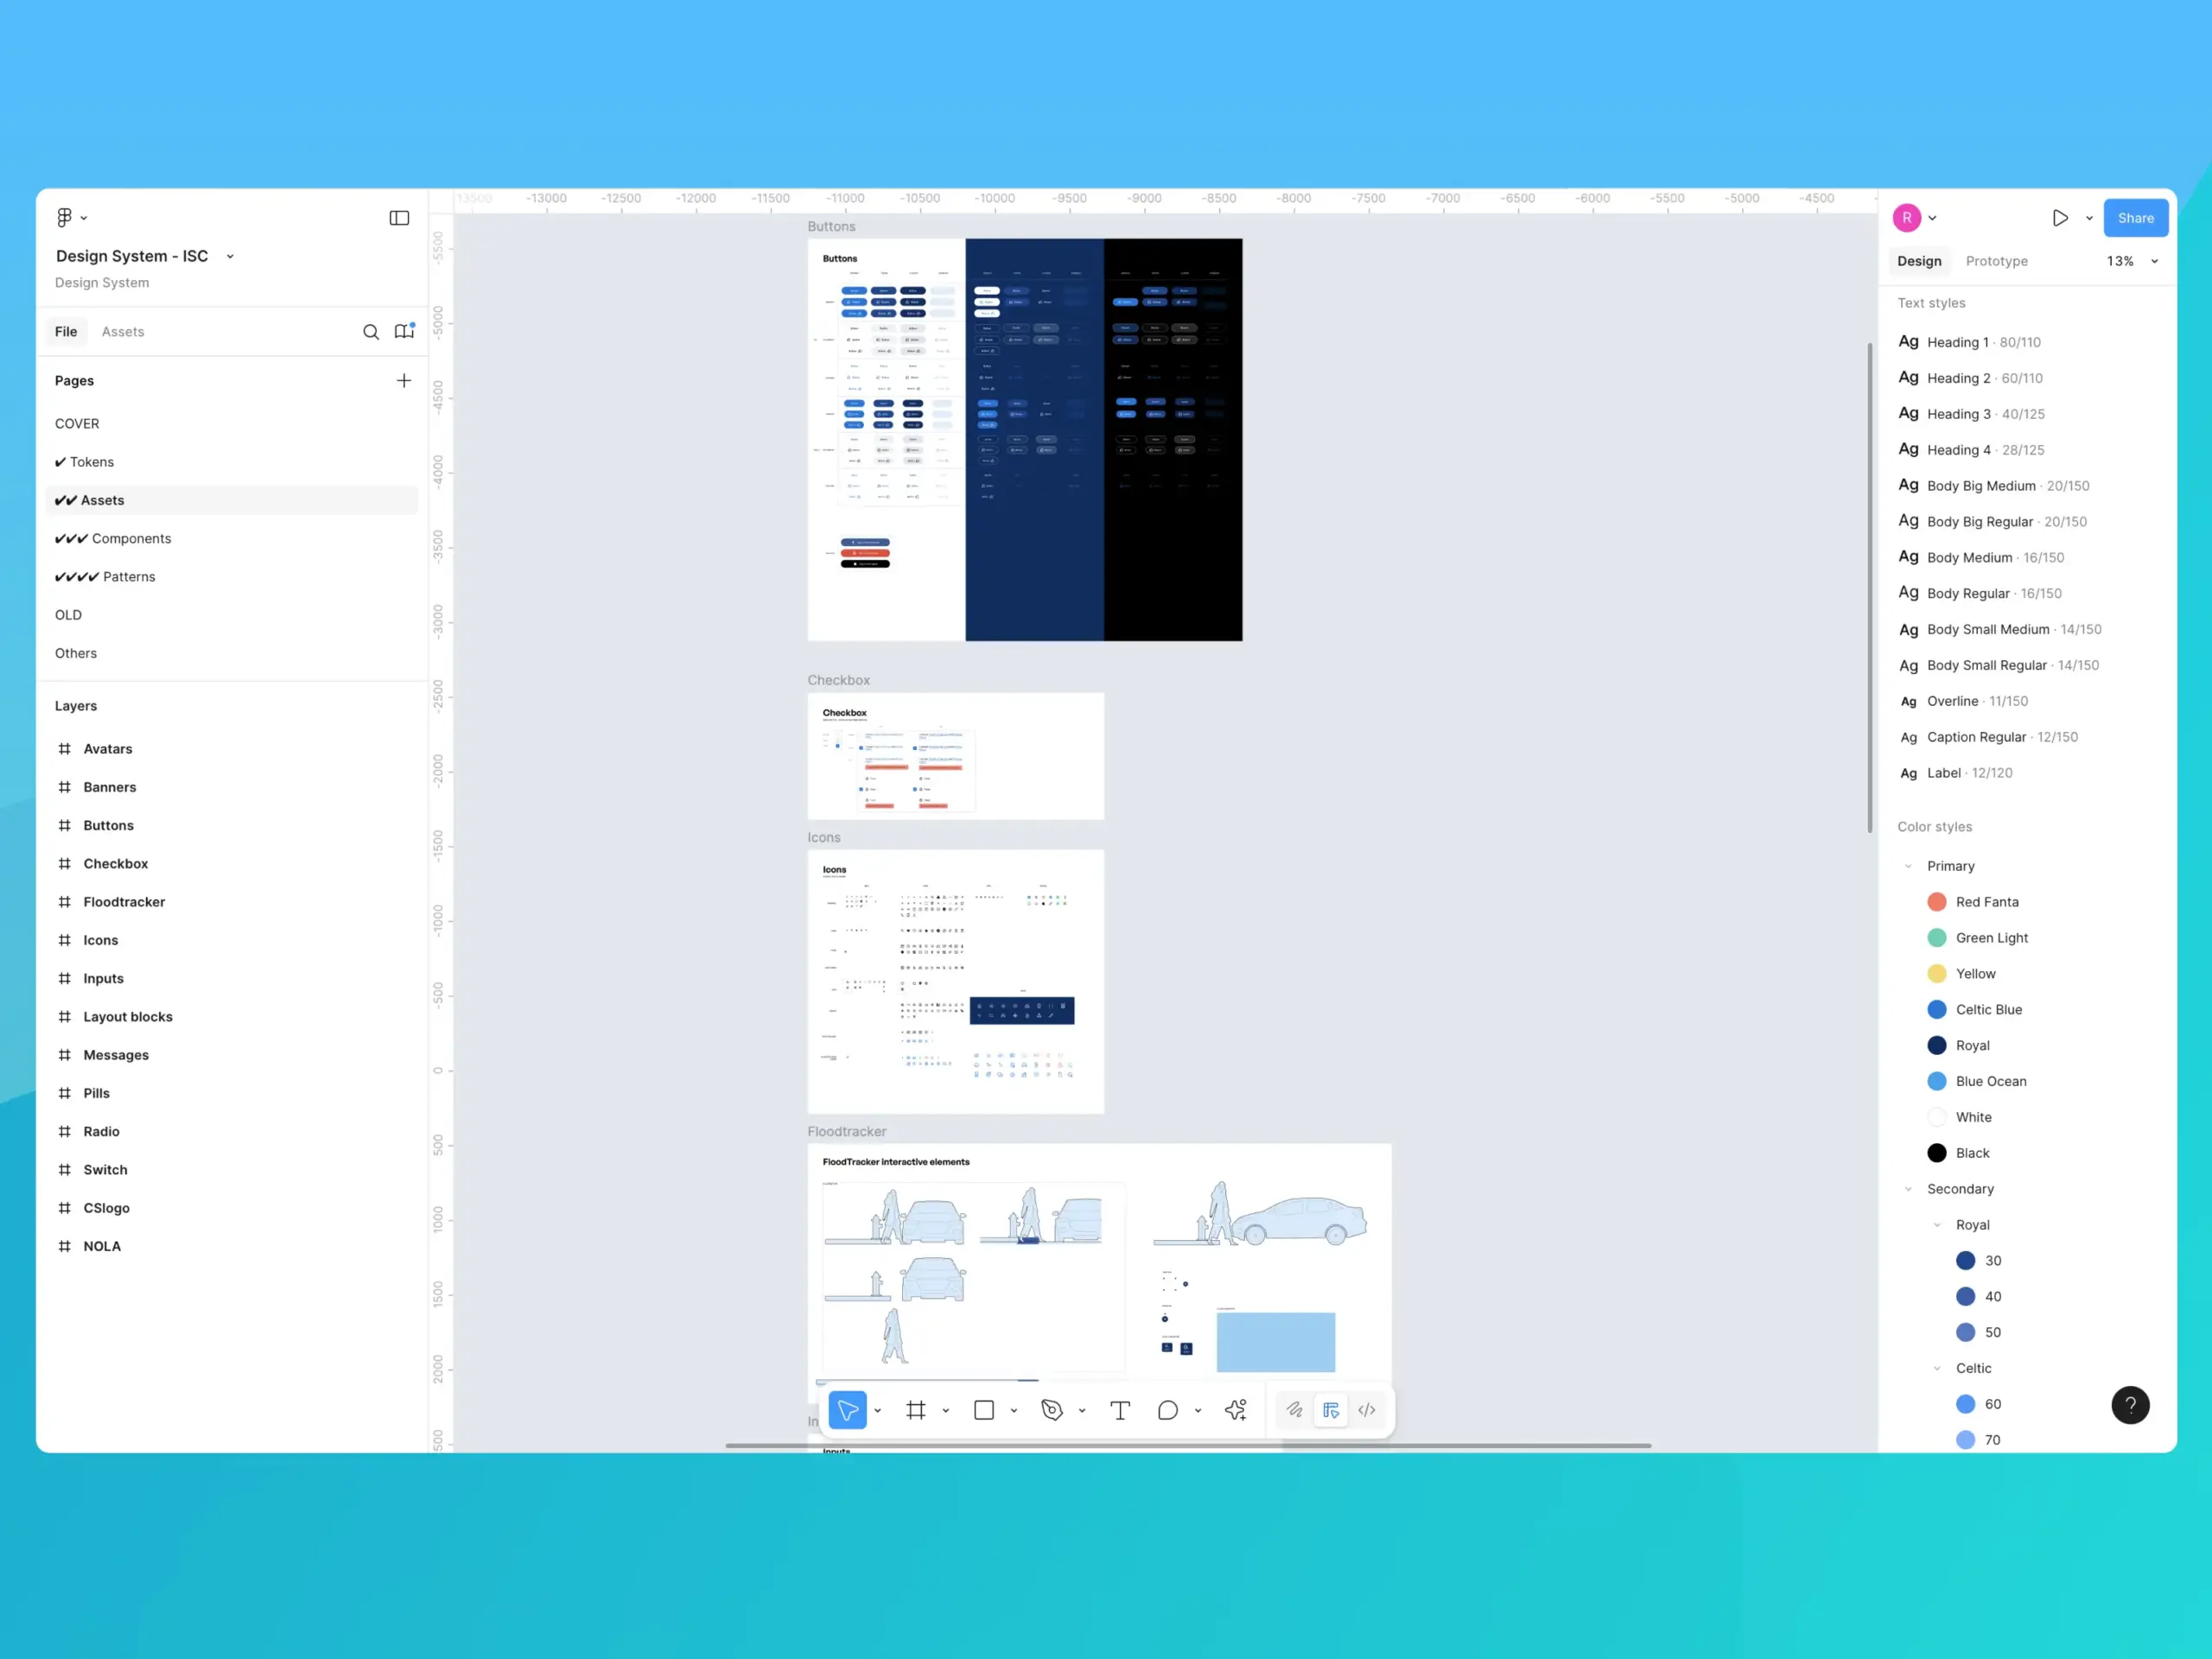
Design System
To support the redesign, I was responsible for setting up, structuring, and maintaining the Design System at ISeeChange.
This system served as a foundation, ensuring a consistent and cohesive user experience across the apps, websites and customer platform.
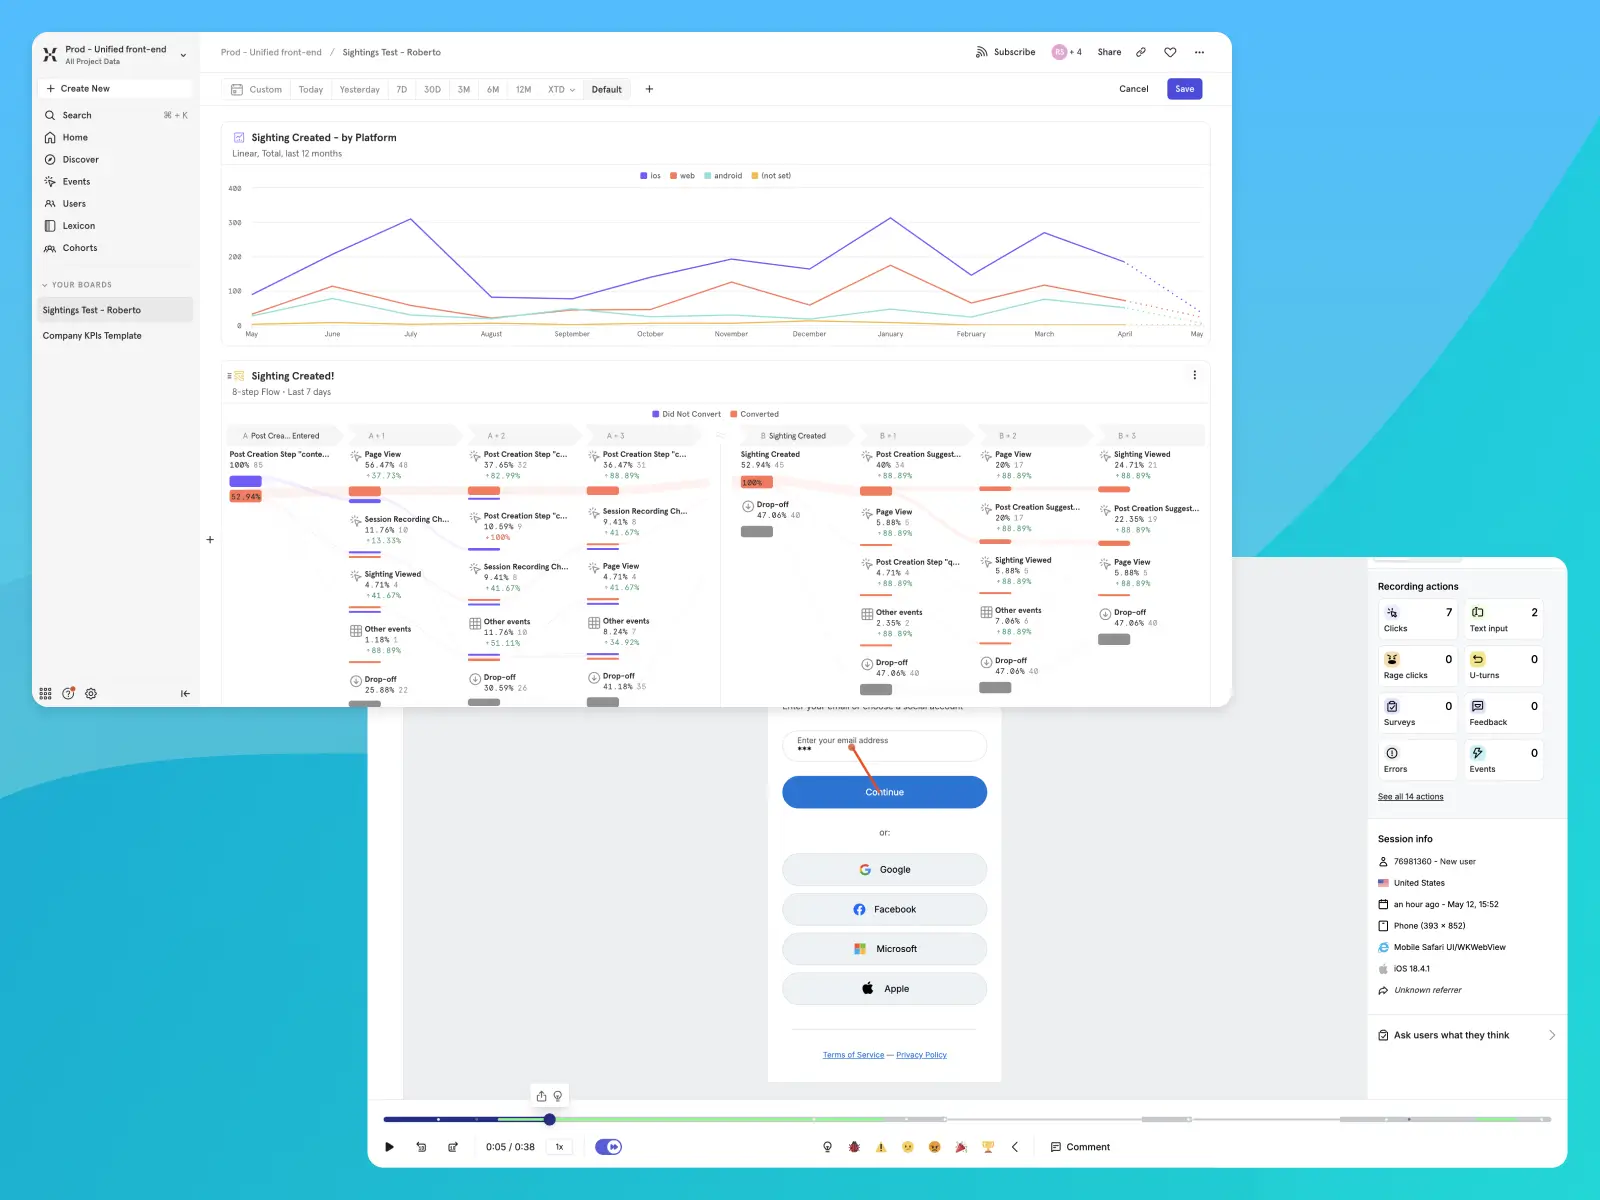
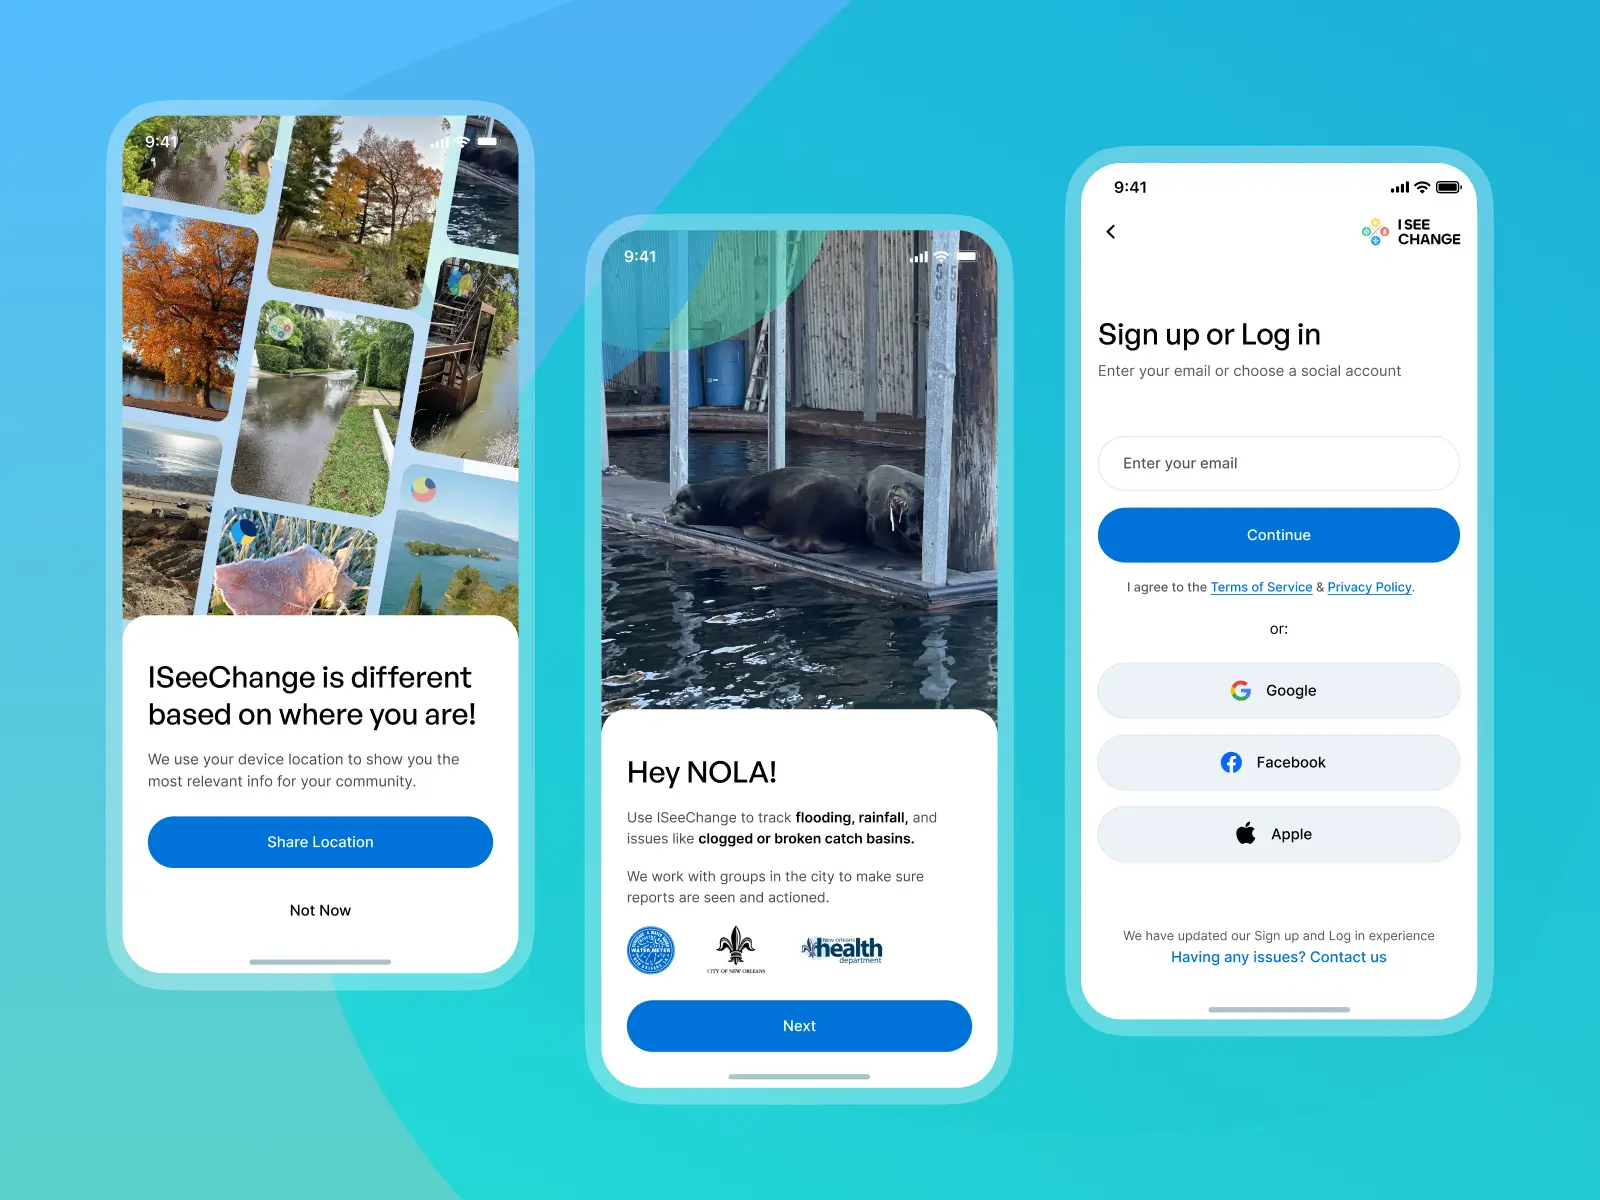
Data Analysis - Hotjar and Mixpanel
We faced a significant drop-off at the signup/login stage, with the existing form underperforming.
To address this, I designed and implemented an A/B test for a revised form. Using Mixpanel flows and Hotjar recordings, I analyzed user behavior and pinpointed friction points.
Polished UX Flows
The new version showed a clear improvement. Conversion rates increased to 80%, and user errors and drop-offs significantly decreased.
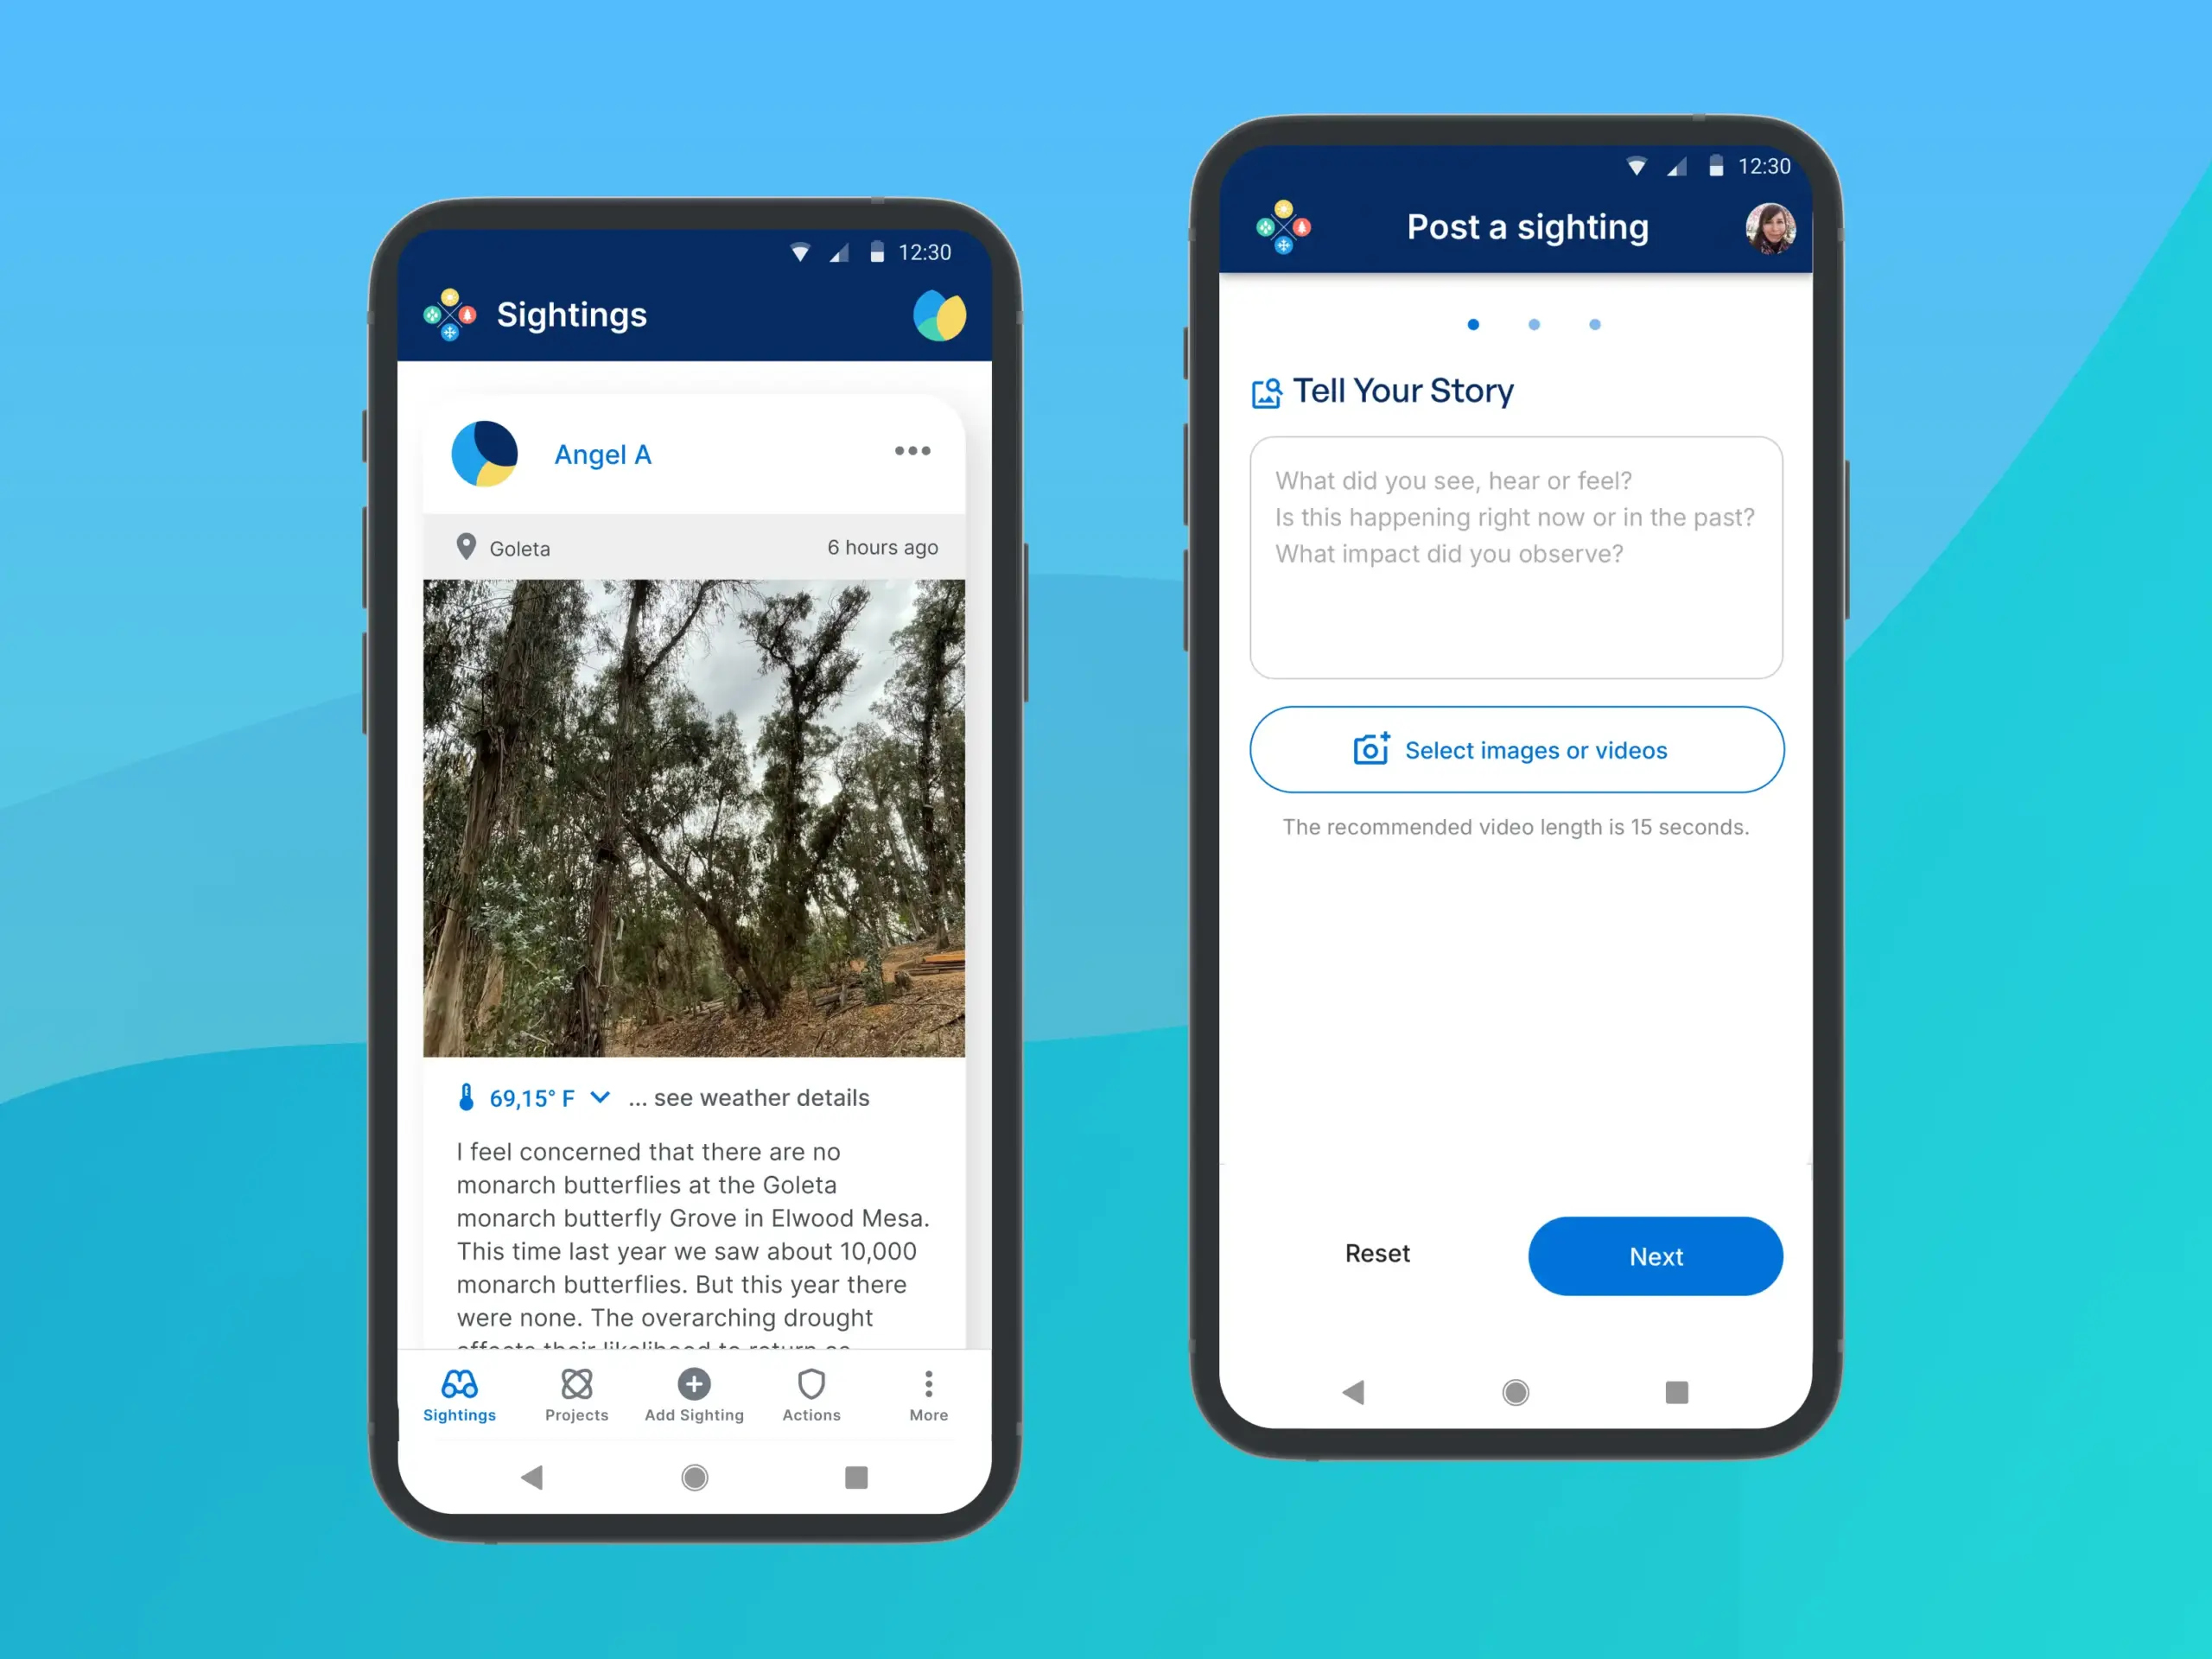
New Posting Experience
To address inconsistent and low-detail user reports, we designed FloodTracker and HeatTracker, guided posting flows focused on flooding and extreme heat.
These tools helped users share more structured, relevant observations, improving data quality for community storytelling and city-level climate analysis.
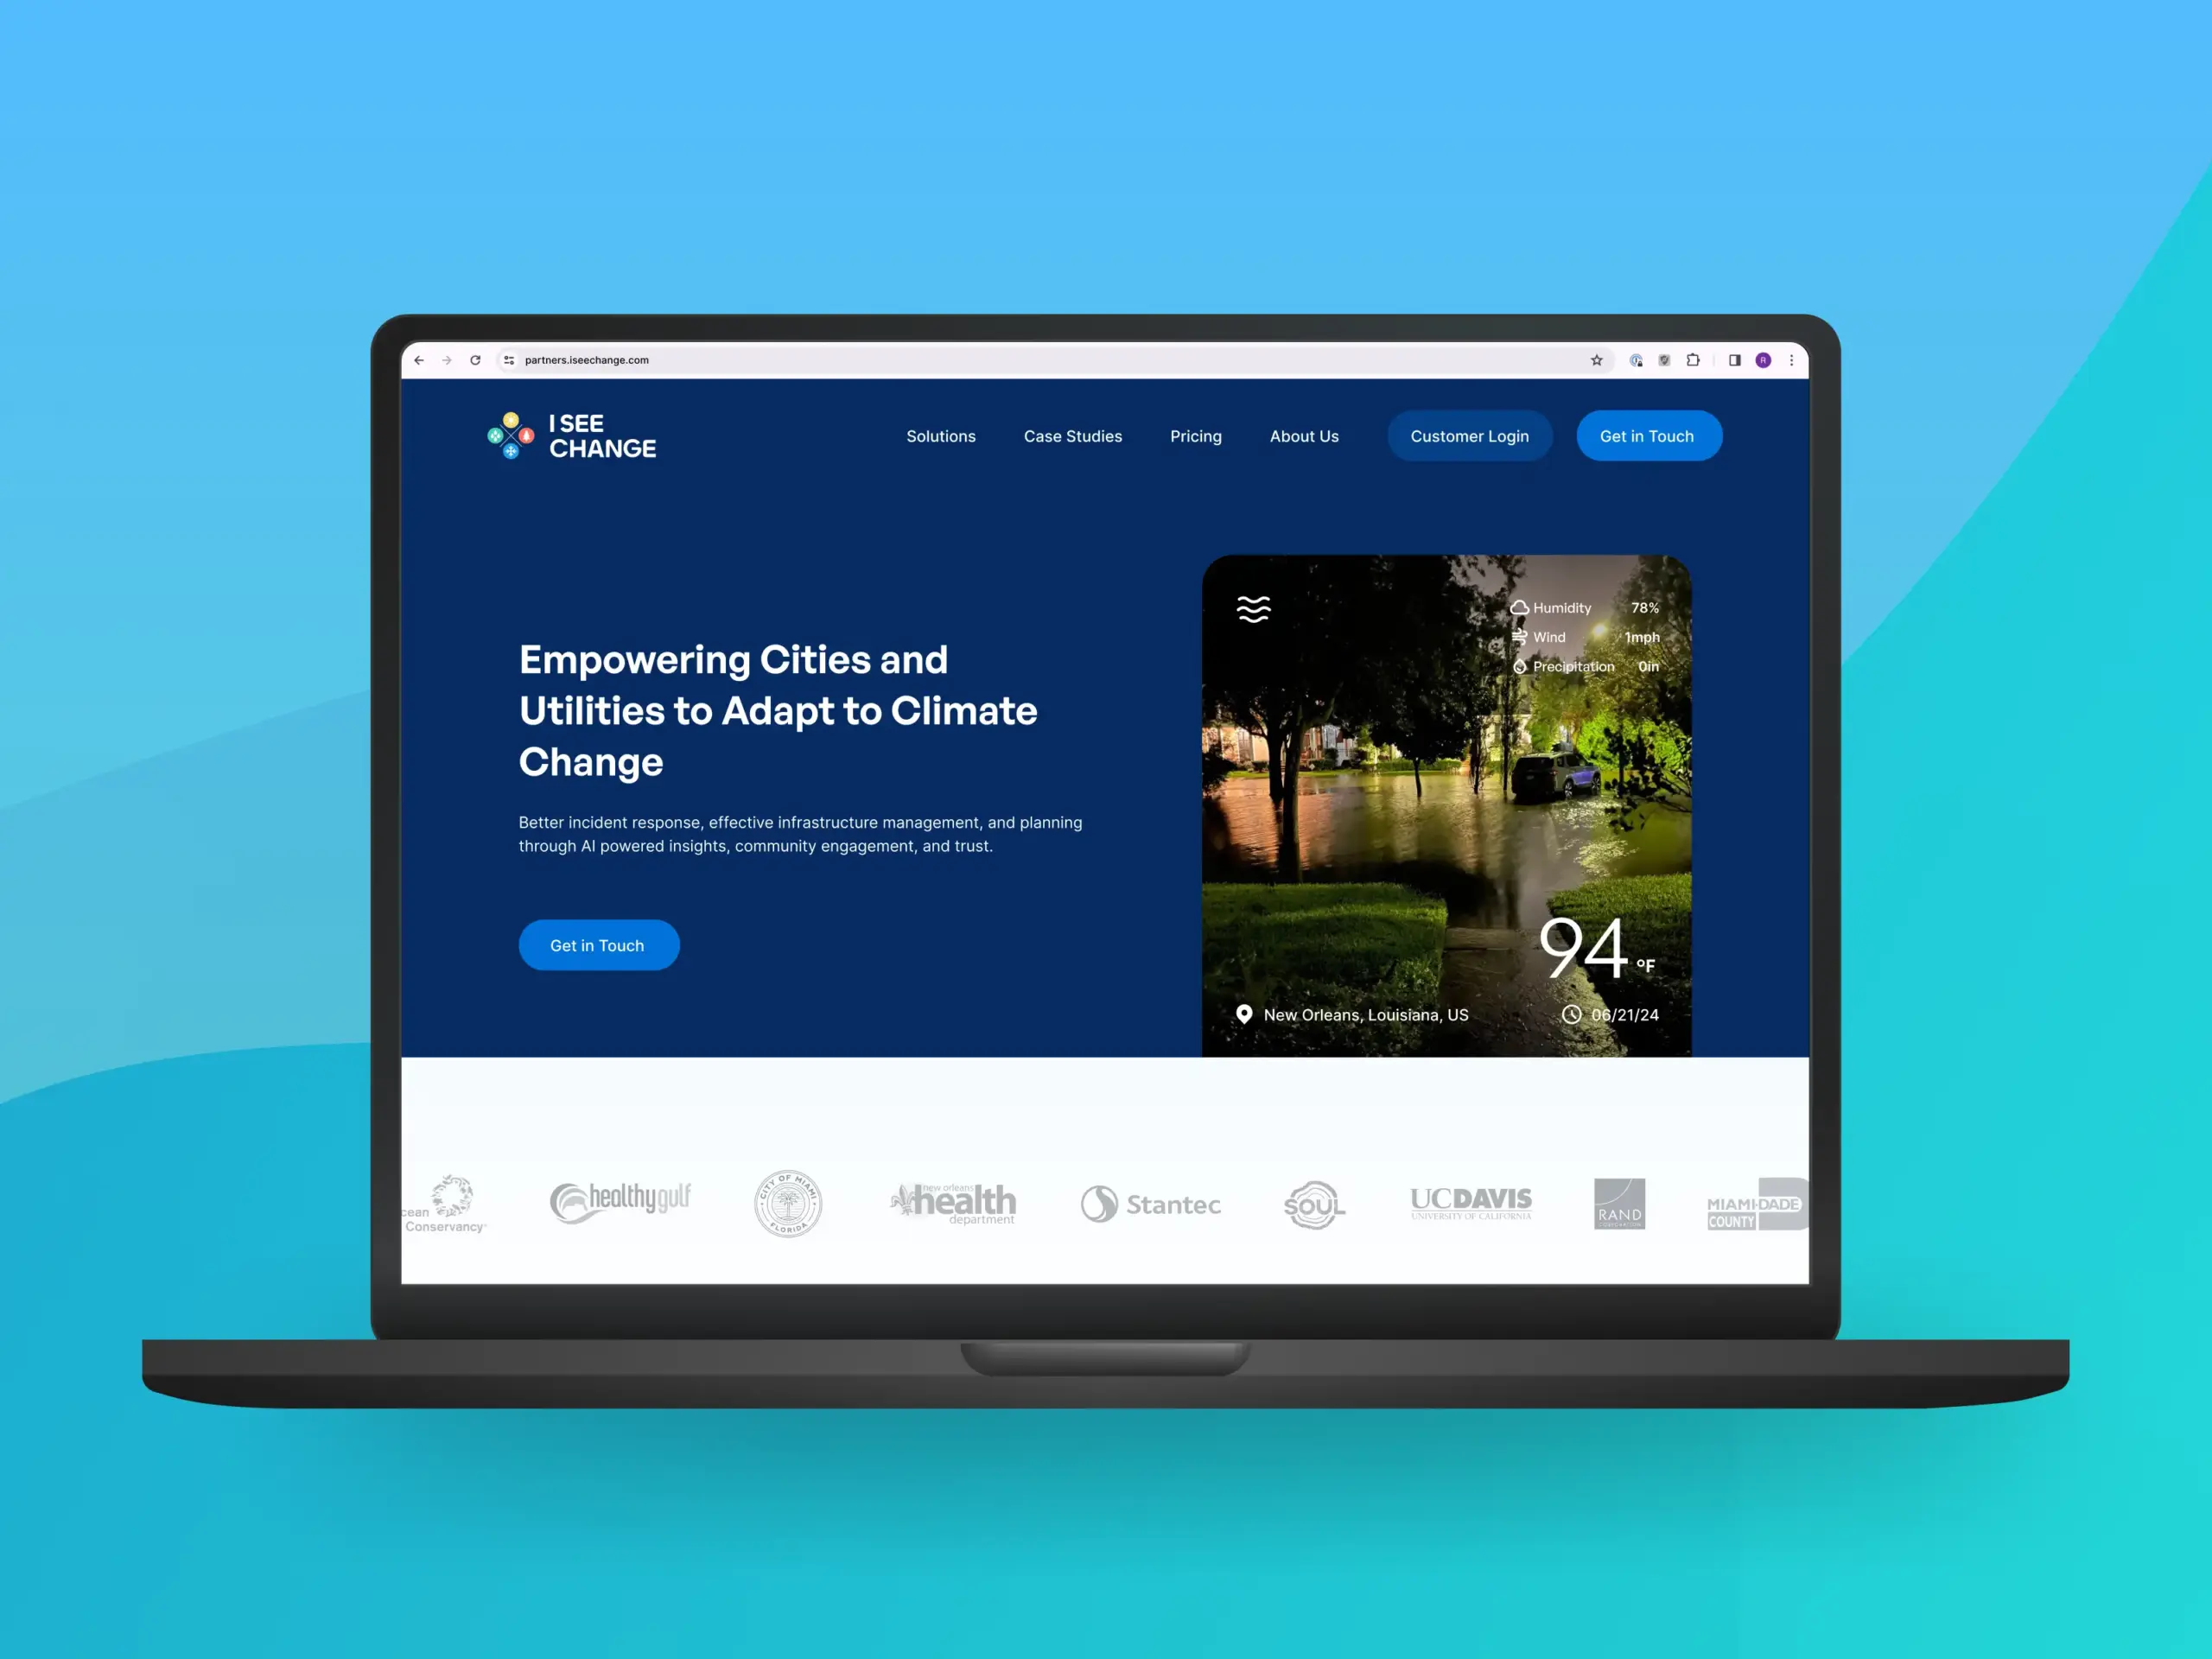
Partner Lead Generation
As a final step, I designed and launched a new partner portal in Webflow.
A public-facing site that helps ISC attract and onboard new partners.
It clearly communicates the value of the platform, showcases use cases, and makes it easy for organizations to get in touch.
To support outreach and growth, I set up lead generation funnels using clear CTAs and downloadable assets.